Report
5 min read
• Sept. 17, 2026Sustained oil and gas investment is more important than ever
- Oil and natural gas supply from producing wells naturally declines over time, which requires investment in new and existing fields to meet demand across scenarios.
- Technology is a key enabler for improved recovery from both new and existing fields.
- LNG market projected to double by 2050 as global gas demand grows.
Report
5 min read
• Sept. 17, 2026As the world’s demand for oil and gas remains strong, sustained investments are more important than ever.
$ Oil investment per barrel of depletion
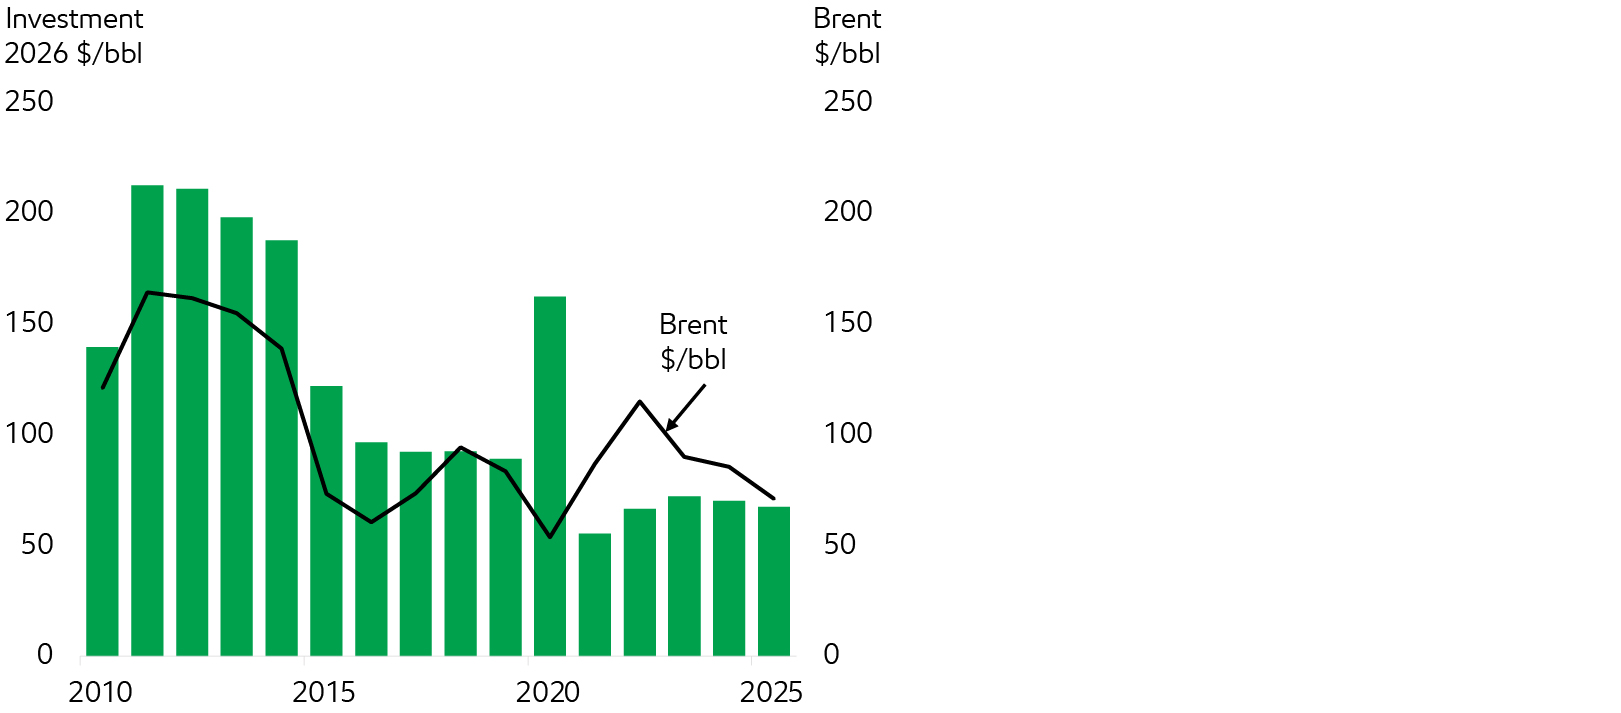
Over the past decade, upstream oil investment has declined ~30%. Over this same period, natural decline without investment from oil fields has increased to ~15% due to the growing share of “unconventional” resources in the global production mix. When we normalize oil investment levels to natural depletion, we find that investment levels have dropped by ~45%.
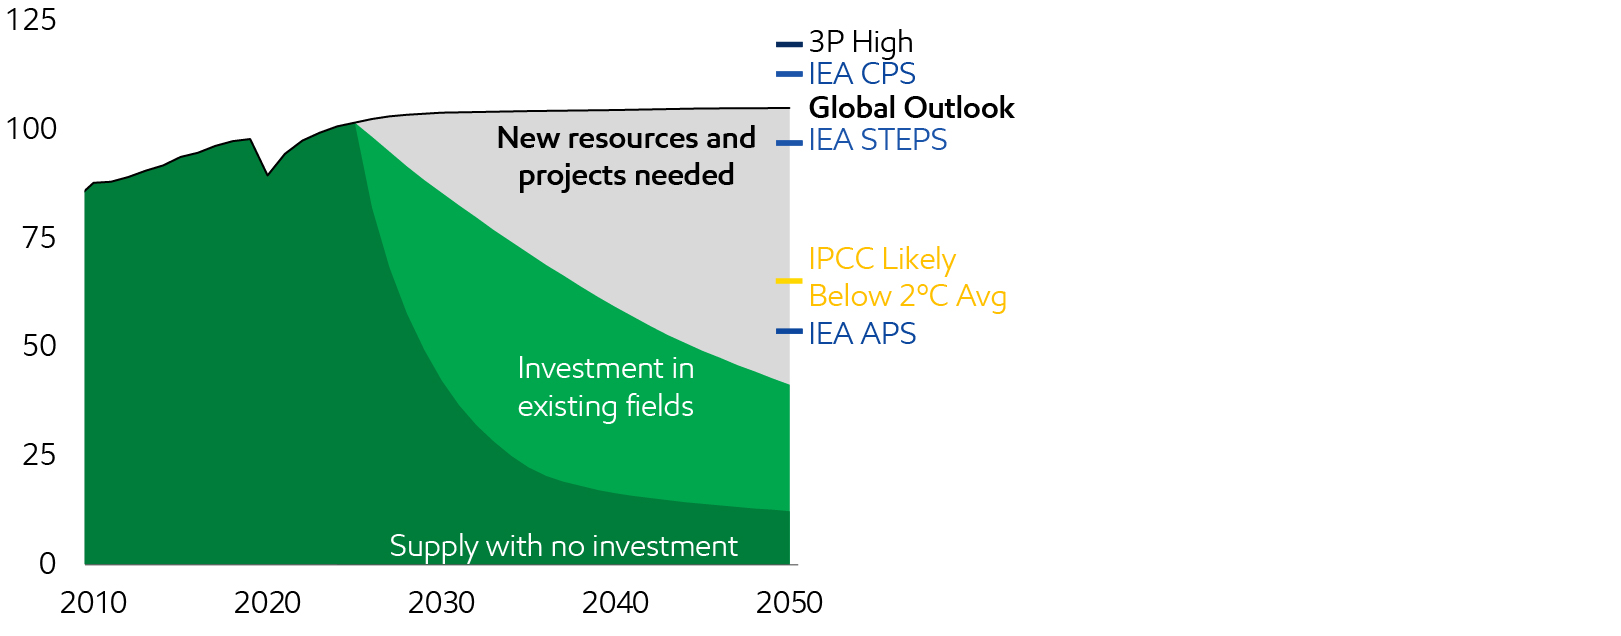
Global oil projected supply and demand
Million barrels per day
Oil excludes biofuels
Sources: IPCC AR6 Scenarios Database hosted by IIASA release 1.0 average of 306 IPCC C3: “Likely below 2°C” scenarios
IEA scenarios from ‘24 WEO and ’25 WEO; 3rd Party high 2026 OPEC WOO Equitable Growth
Decline rates based on 10-yr CAGR
Our Outlook projects that oil demand will reach ~105 million barrels per day in 2050, up from slightly above 100 million barrels per day in 2025. Even under the average of IPCC Likely Below 2°C scenarios, oil demand still comes to ~65 million barrels per day in 2050 — about two thirds of current consumption. Under high-side 3P scenarios, the world will need ~120 million barrels per day — roughly 20% more than current levels.
Sensitivity: What would happen without any new investment in oil production? Our Outlook shows that oil production declines at a rate of ~15% per year in the absence of new investment. This is the result of the world’s shifting mix toward “unconventional” sources, such as U.S. tight oil. These are mostly shale and dense rock formations that typically decline faster and require specialized technologies and tools.
When we say “without any new investment” we mean a scenario where all investment stops today. No more capital is deployed, and producers simply squeeze out what they can from each well. By 2035, this approach would leave the world undersupplied by about 80 million barrels per day.
As an alternate sensitivity, we consider a case where investment is limited to existing fields, including keeping these fields operating, and infill drilling in existing fields and in tight oil fields like the Permian Basin. It does not allow for investment in exploration to find and develop new discoveries. Limiting investment to only existing fields would slow the decline to ~4%; however, this would still be well below the oil demand in the IEA APS and IPCC Likely Below 2°C scenarios in 2050.
Similar to oil, significant new natural gas supplies are also needed to meet continued demand growth. Continued investment is critical to sustain existing fields and develop new supply sources.
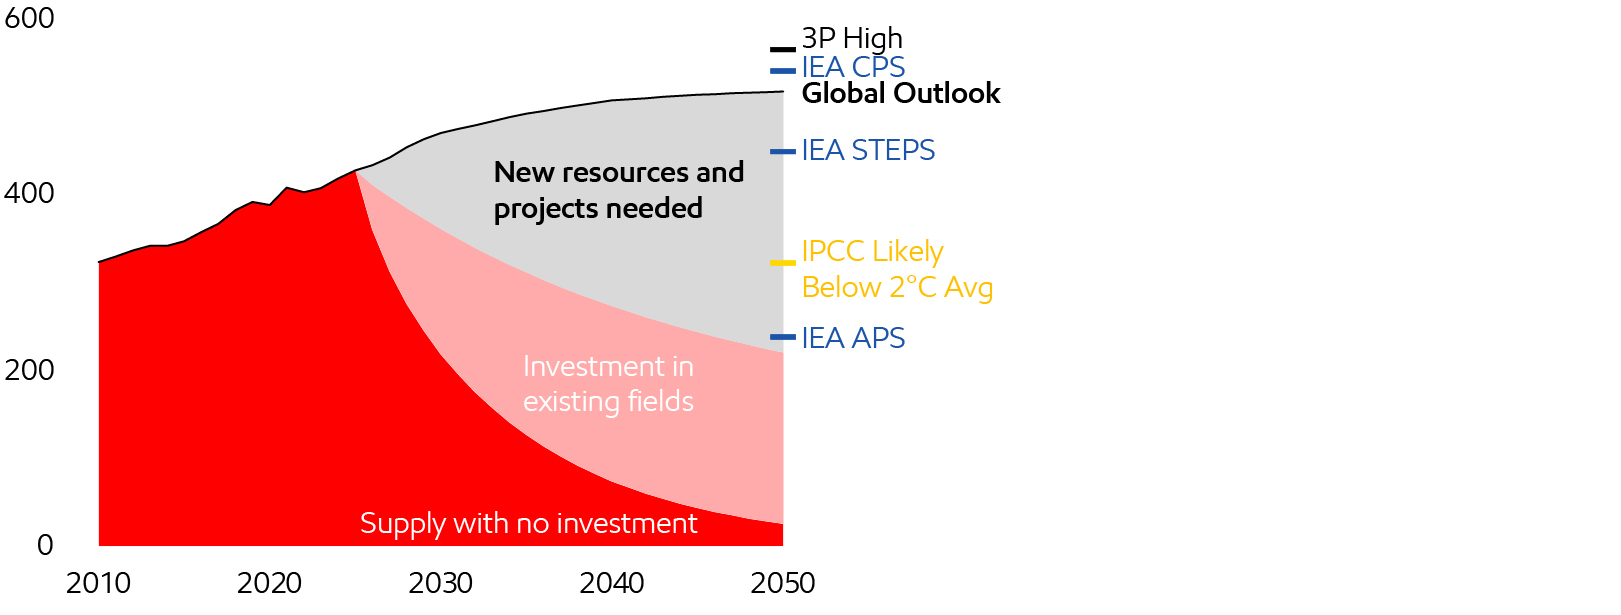
Natural gas projected demand and supply
Billion cubic feet per day
Excludes flaring
IPCC AR6 Scenarios Database hosted by IIASA release 1.0 average of 306 IPCC C3: “Likely below 2°C” scenarios
IEA scenarios from ‘24 WEO and ’25 WEO; 3rd Party high 2026 OPEC WOO Equitable Growth
In the absence of new investment starting today, global natural gas supply would decline at ~11% per year, resulting in a shortfall of >350 billion cubic feet per day by 2035, or about 75% of projected global demand.
Limiting investment to only existing fields would slow the decline to ~3% per year; however, this would still fall below the levels needed in the IEA APS and IPCC Likely Below 2°C scenarios.
Sustained investment in finding and developing new resources is required to fill the gap between supply and projected global demand for both oil and gas through 2050.
The role of technology — U.S. tight oil case study
From 1970 to 2008, U.S. oil production declined nearly 50%, from ~10 million barrels per day to ~5 million barrels per day, reaching levels roughly equivalent to those in 1950. However, the trend of declining U.S. oil production was rapidly reversed with technological advancements including innovative applications of hydraulic fracturing and horizontal drilling (EIA 2018), resulting in the U.S. achieving record oil production (>10 million barrels per day) each year from 2017 to present.
Permian average lateral length
Meters
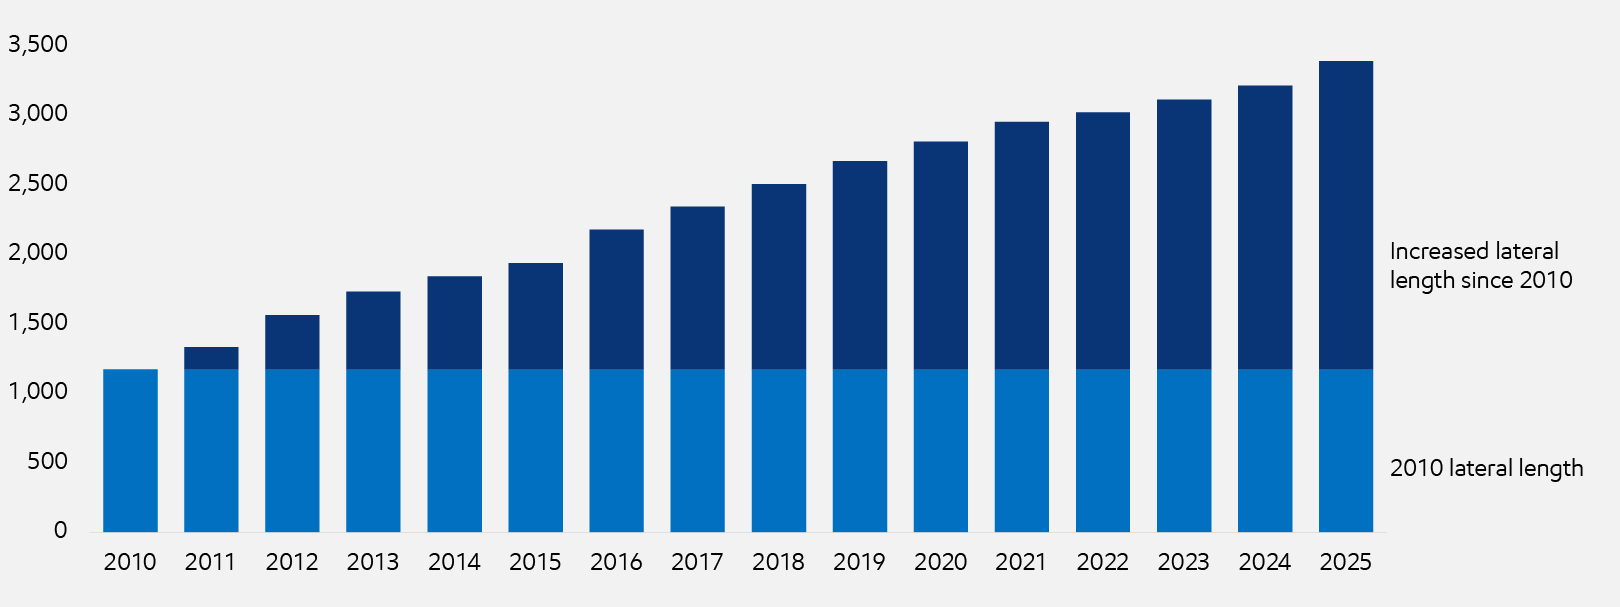
Two of the most significant technological advances enabling U.S. oil production growth have been increasing lateral lengths coupled with improvements in completion technology. Since 2010, the average lateral length of wells in the Permian Basin has increased more than 2.5x. To put that in context, the average lateral length of Permian wells in 2025 was >3 km (~2 miles). During this same period, completion size (measured in kg of proppant per meter of lateral length) has also increased more than ~4x.
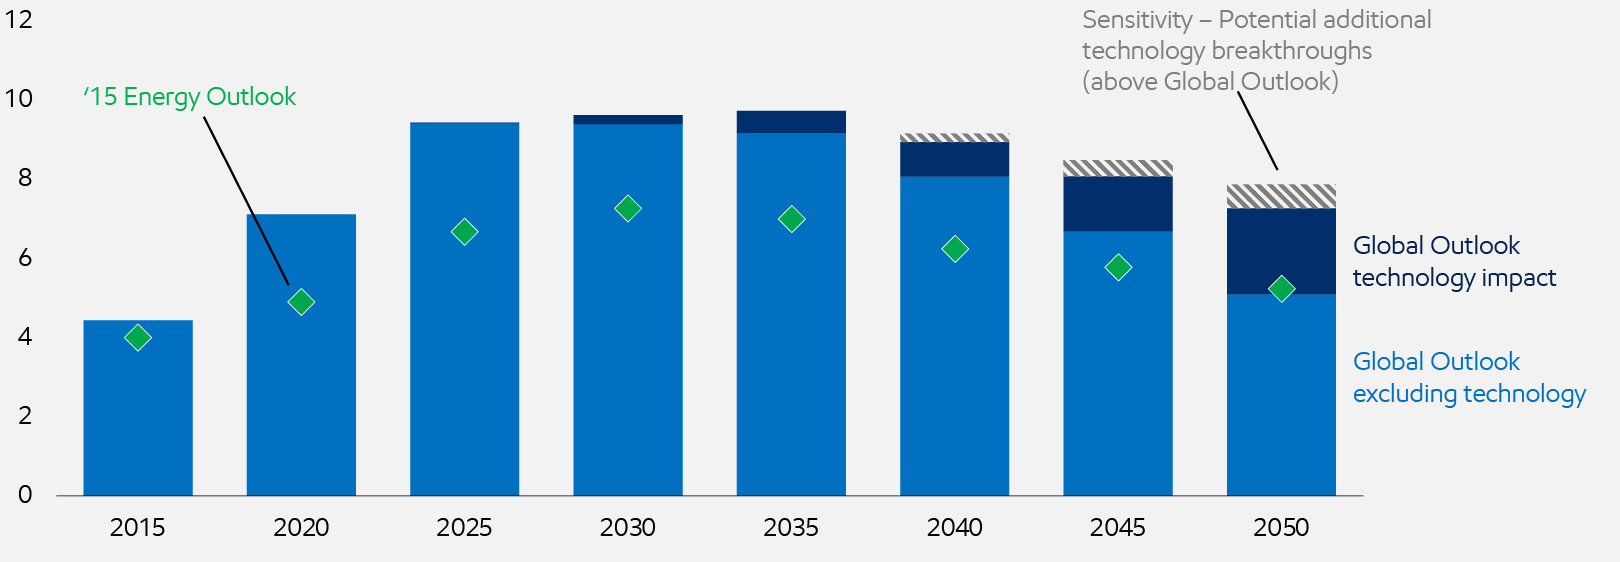
U.S. tight oil production
Million barrels of oil per day
Source: ExxonMobil analysis
Based on our Outlook, North American oil production is projected to peak sometime next decade as U.S. tight oil fields mature. However, technology-driven efficiency and productivity improvements continue to play a major role in future U.S. tight oil production trends. Looking back at our 2015 Outlook, we now project that U.S. tight oil production will be ~40% higher than what we thought a decade ago, driven by continuous improvement in technology. Our base case projection to 2050 incorporates continued technological advancements, including fracture technology improvements such as lightweight proppant and enhanced oil recovery techniques.
Sensitivity: What would happen with even more technology innovation? In this sensitivity, we evaluate the impact of potential additional technological breakthroughs on U.S. tight oil production. Advances that drive sustained improvements in well productivity could add ~0.5 million barrels per day in 2050, helping to offset long-term declines. Conversely, we see that a lack of continuous technology innovation and scalability would lead to a potential reduction of ~2 million barrels per day by 2050.
Regional supply/demand trends
Liquids supply
By region and type - Million barrels per day of oil equivalent
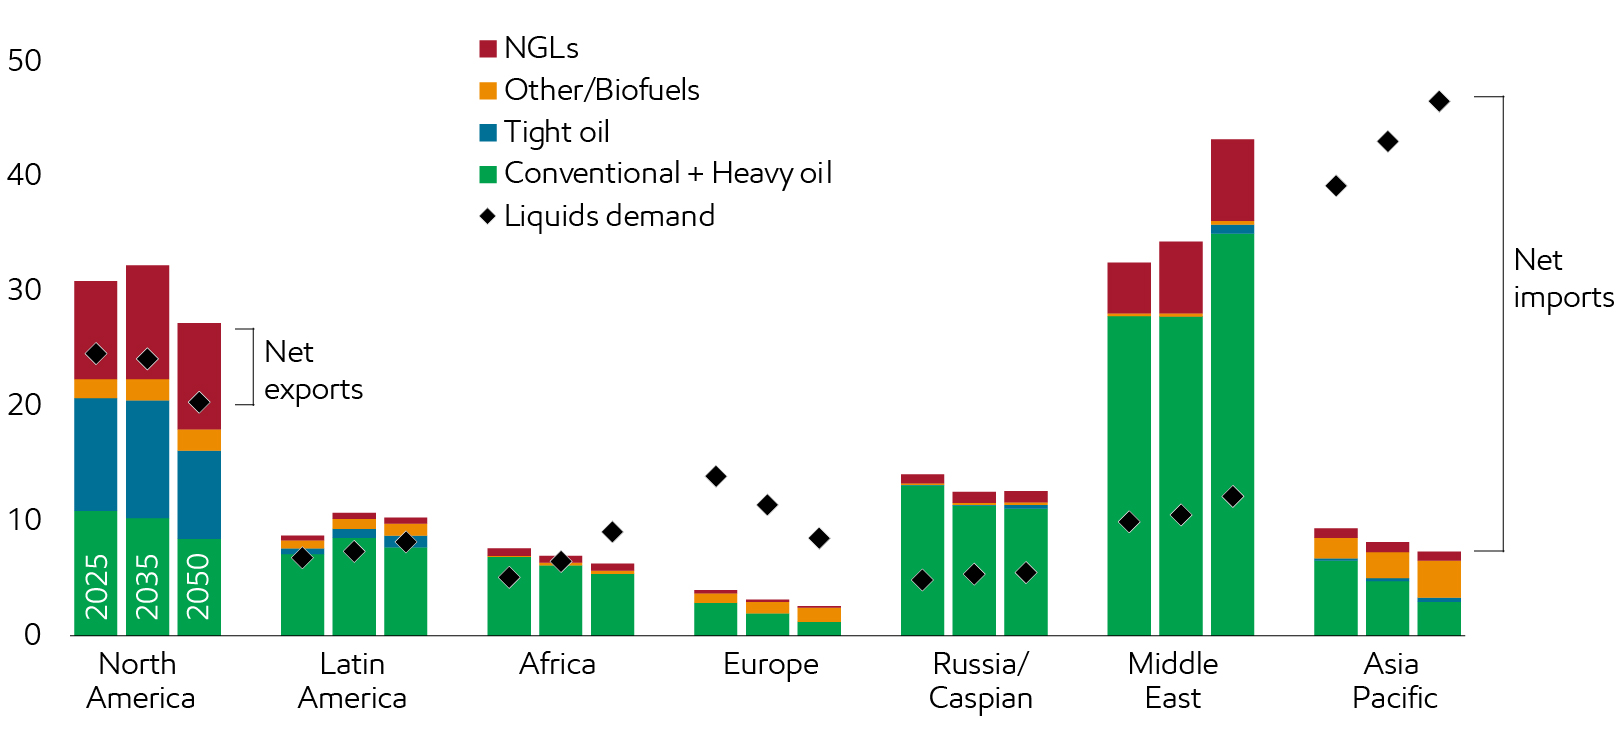
There is significant regional variation in liquids supply/demand balance. Asia Pacific continues to be the largest and fastest-growing region for liquids demand, and it increasingly relies on imports. The Middle East is projected to increase its share of production post-2035, meeting the majority of future growth in demand.
Natural gas supply diversifies and trade grows to meet rising demand
Billion cubic feet per day
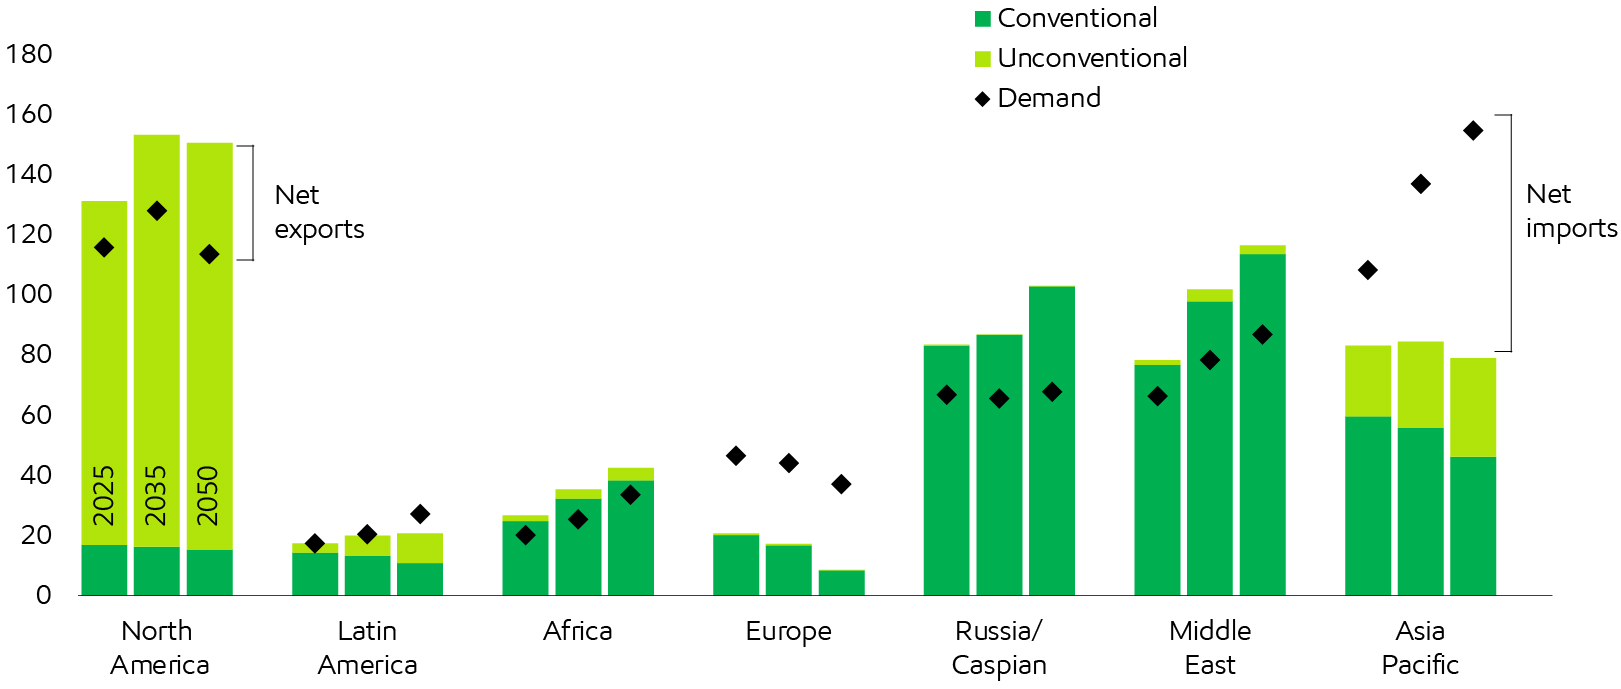
North America is projected to continue to be the largest natural gas producer, supporting both domestic demand and a growing export market. The Middle East will see the largest production growth, also supporting both growing domestic demand and export markets. Significant demand growth in Asia Pacific will primarily be met by imported gas. Europe is also projected to continue to rely on natural gas imports to provide affordable energy necessary to support industrial and commercial sectors.
LNG is needed to meet the world’s growing energy demand
In 2025, LNG trade met nearly 15% of global natural gas demand and is projected to increase to >20% by 2050 as global demand for LNG doubles.
LNG demand
Billion cubic feet per day
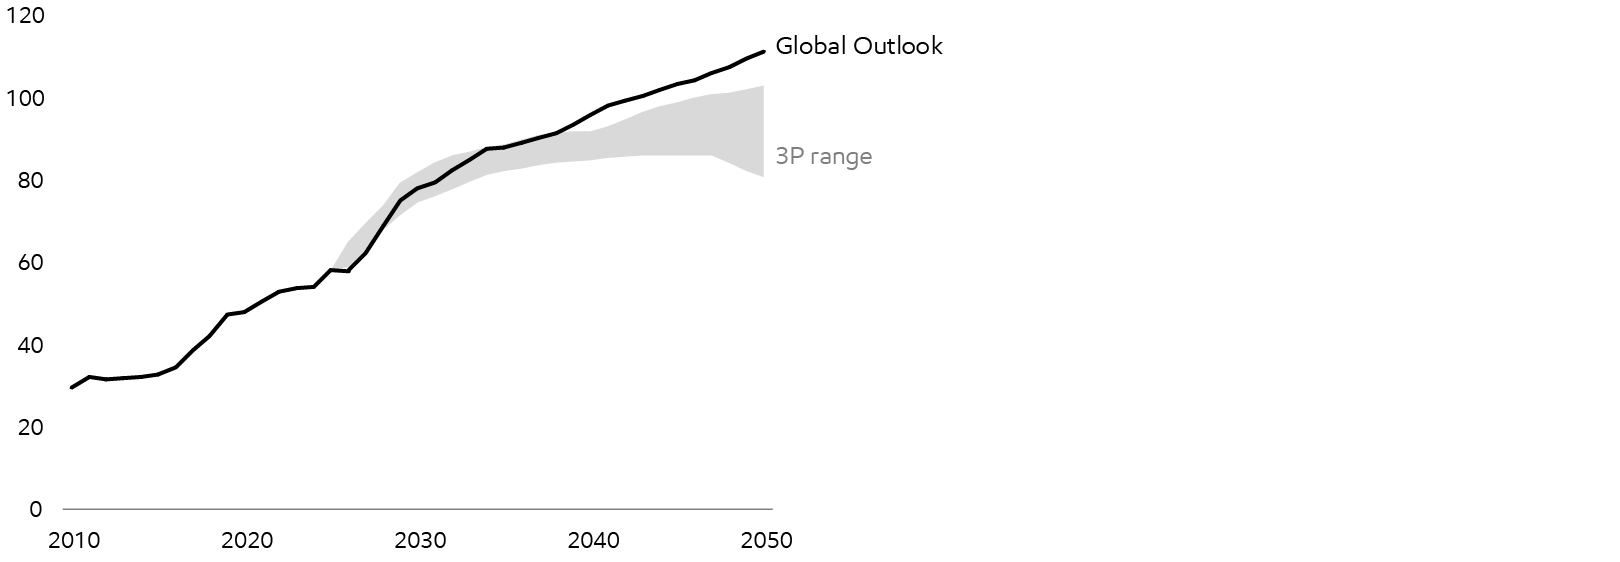
3P range includes: Wood Mackenzie Global Gas SPO (2025), S&P Inflections (2025), BP New Momentum (2025), Shell Surge (2026), Rystad Gas Market Cube (2025), and IEA Supply/Demand Outlook to 2050 (2025); ExxonMobil Analysis
The variety and reliability of LNG supplies, combined with the flexibility to ship it where it is needed, make LNG a favorable choice for nations needing dependable, lower-emission energy sources to foster economic growth.
Asia Pacific and Europe benefit from LNG imports
Billion cubic feet per day
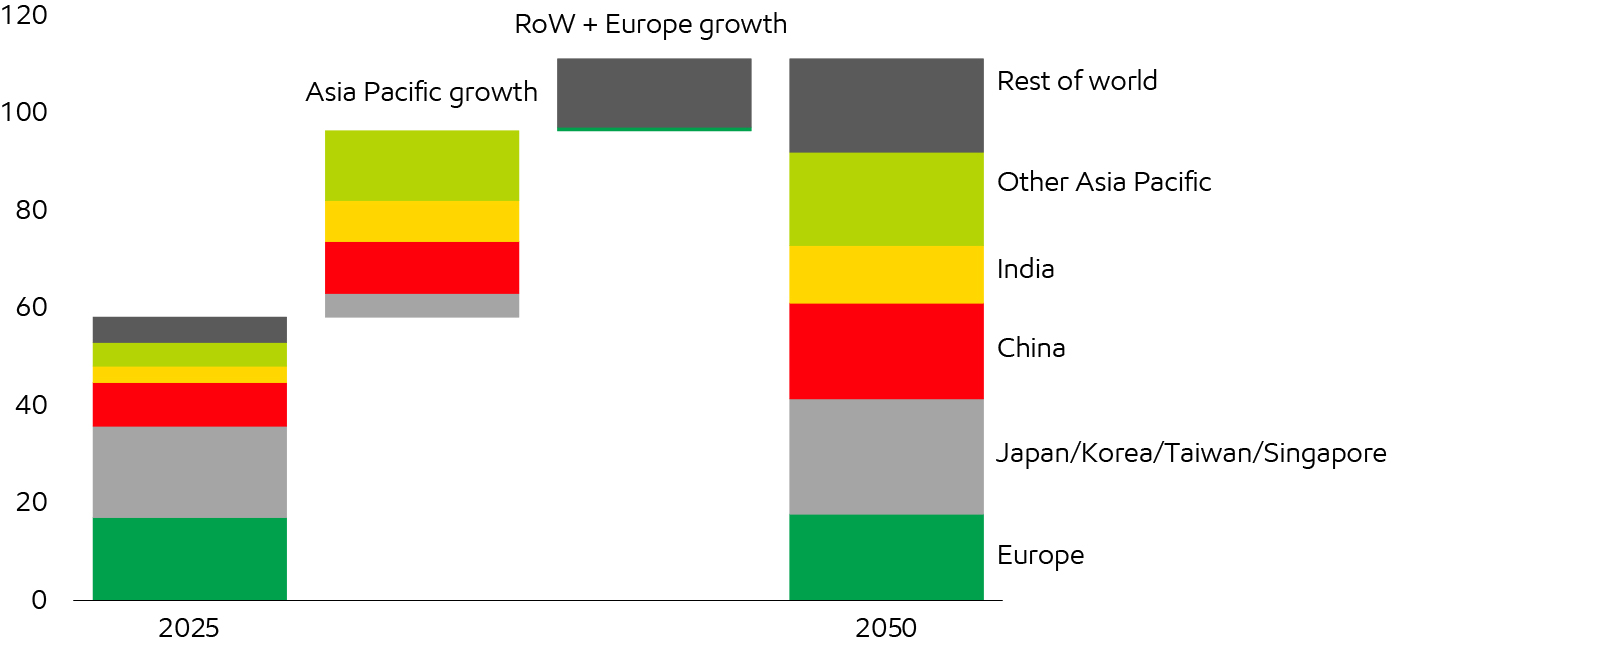
Demand in Asia Pacific will drive ~70% of the growth in LNG from 2025 to 2050, helping the region to reduce its carbon intensity while sustaining economic growth.
Diverse natural gas supplies underpin new LNG exports
Billion cubic feet per day
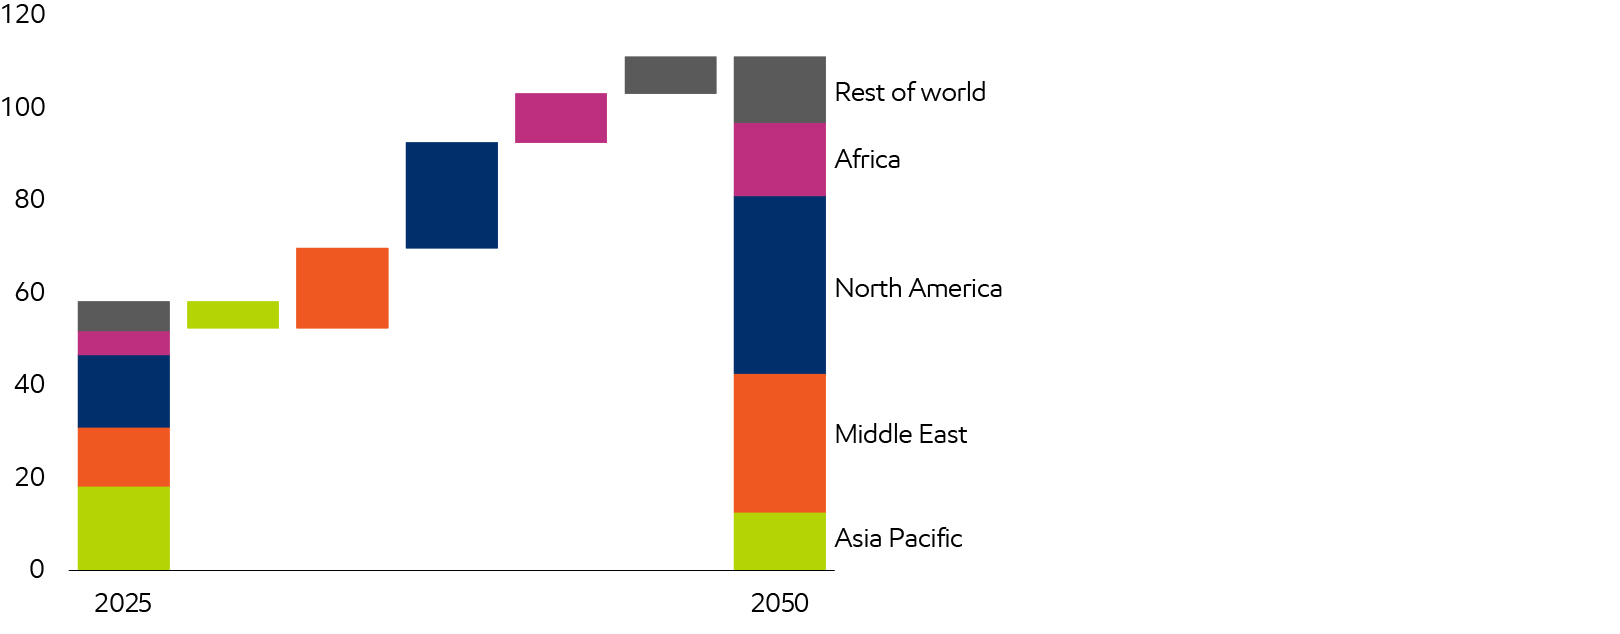
New supplies of LNG will predominantly come from North America, the Middle East, and Africa. North America’s abundant unconventional natural gas is projected to both feed new LNG projects and meet growing local demand. Africa’s natural gas production could drive economic growth and prosperity, as demand and exports are poised to accelerate, led by Mozambique and Nigeria. The Middle East is expected to continue investing in LNG export projects, more than doubling their export capacity by 2050.
-
All energy types will be needed
Under any credible scenario, oil and gas remain essential.Learn more -
About the ExxonMobil Global Outlook
Learn moreThe Global Outlook is ExxonMobil’s view of energy demand and supply through 2050.
Global Outlook
Explore more



Cautionary statement
The Global Outlook includes ExxonMobil Holdings Corporation’s internal estimates of both historical levels and projections of challenging topics such as global energy demand, supply, and trends through 2050 based upon internal data and analyses as well as publicly available information from many external sources including the International Energy Agency. Separate from ExxonMobil’s analysis, we discuss a number of third-party scenarios such as the Intergovernmental Panel on Climate Change Likely Below 2°C and the International Energy Agency scenarios. Third-party scenarios discussed in this report reflect the modeling assumptions and outputs of their respective authors, not ExxonMobil, and their use and inclusion herein is not an endorsement by ExxonMobil of their results, likelihood, or probability. Work on the Outlook and report was conducted during 2025 and 2026. The report contains forward-looking statements, including projections, targets, expectations, estimates, and assumptions of future behaviors. Actual future conditions and results (including but not limited to energy demand, energy supply, the growth of energy demand and supply, the impact of new technologies, the relative mix of energy across sources, economic sectors and geographic regions, imports and exports of energy, emissions, and plans to reduce emissions) could differ materially due to changes in a number of factors, including: economic conditions, the ability to scale new technologies on a cost-effective basis, unexpected technological developments, the development of new supply sources, changes in law or government policy, political events, demographic changes and migration patterns, trade patterns, trade tariffs and trade sanctions, the development and enforcement of global, regional or national mandates, changes in consumer preferences, escalating geopolitical volatility, including regime changes, war, civil unrest, and other political or security disturbances, including disruption of land or sea transportation routes, decoupling of economies, realignment of global trade and supply chain networks, and disruptions in military alliances and other factors discussed herein and under the heading “Factors Affecting Future Results” in the Investors section of our website at https://corporate.exxonmobil.com/.
The Outlook was published in September 2026. ExxonMobil assumes no duty to update these statements or materials as of any future date, and neither future distribution of this material nor the continued availability of this material in archive form on our website should be deemed to constitute an update or re-affirmation of this material as of any future date. The Global Outlook is a voluntary disclosure and is not designed to fulfill any U.S., foreign, or third party required reporting framework. This material is not to be used or reproduced without the express written permission of ExxonMobil Holdings Corporation. All rights reserved.