
Report
5 min read
• Sept. 17, 2026CO₂ emissions fall 20% by 2050, but more progress is needed
- Global energy-related CO2 emissions continued to rise at ~1% in 2025, which is unchanged vs. the 20-year average (since Kyoto).
- Efficiency improvements and renewables are necessary but not a complete solution.
- Technologies like hydrogen, carbon capture and storage, and biofuels have yet to reach their full potential but will be needed to reduce emissions for heavy industry and commercial transportation by 2050.
- There are multiple potential emissions pathways to achieve society’s climate goals, giving policy makers an opportunity to balance affordability and emissions reduction.
Report
5 min read
• Sept. 17, 2026For the first time in modern history, emissions are projected to peak and begin a sustained decline this decade even as economies expand and living standards improve. By 2050, we project global CO2 emissions to decline by 20% from current levels. This happens because efficiency will improve, and the world will use more lower-emissions technologies, including renewables, carbon capture and storage, hydrogen, and biofuels while reducing use of coal.
Global energy-related emissions
CO2 Billion metric tons
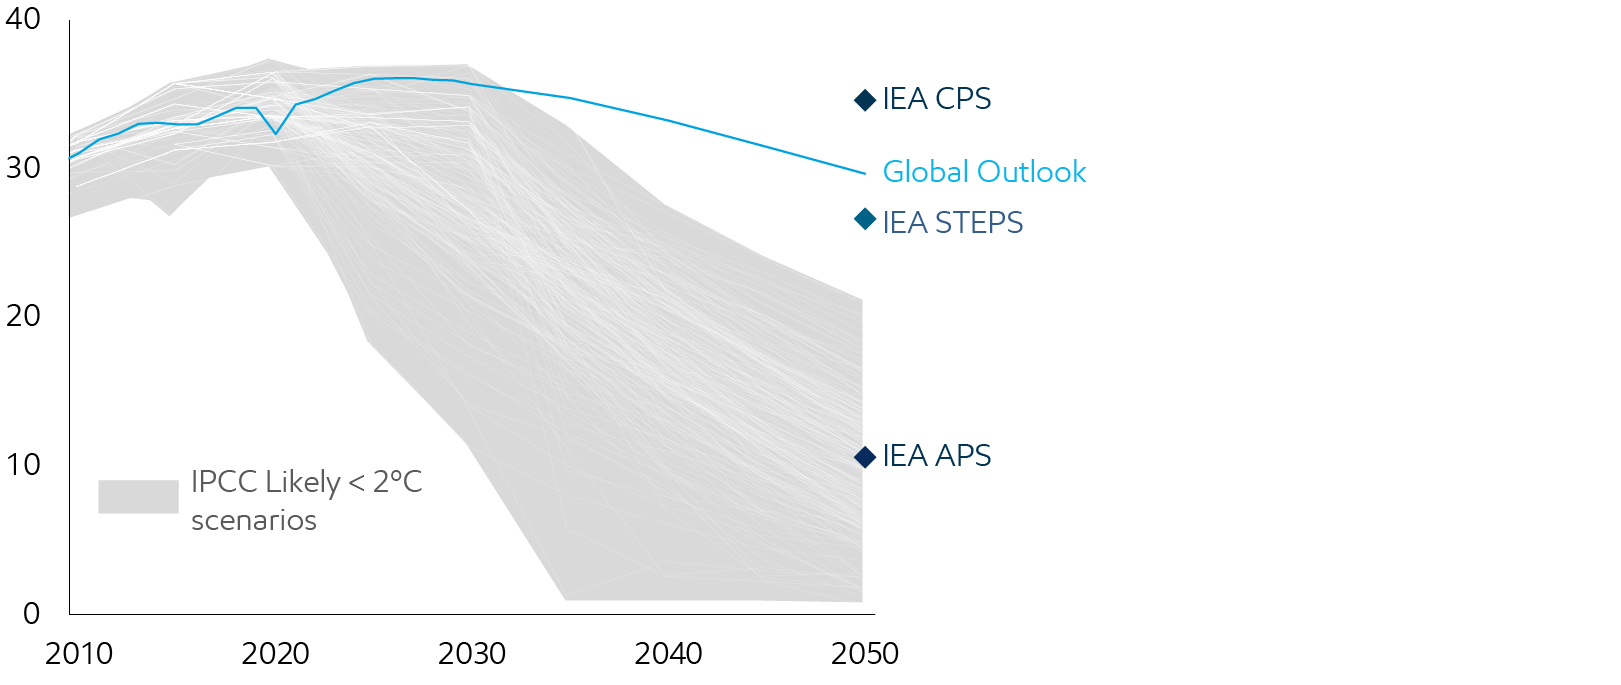
Source: 2025 IEA World Energy Outlook; 2024 IEA World Energy Outlook; IPCC: AR6 Scenarios Database hosted by IIASA release 1.0 average IPCC C3: “Likely Below 2°C” scenarios
Emissions do not contain industry process emissions or land use and natural sinks
Overall, energy-related CO2 emissions are projected to peak at approximately 36 billion metric tons per year sometime this decade and then decline to approximately 30 billion metric tons per year in 2050.
That will be great progress. Even so, more is needed to reach emission levels consistent with keeping global temperature increases below 2°C. The average of the IPCC’s Likely Below 2°C scenarios requires energy-related CO2 emissions to fall to around 11 billion metric tons per year by 2050.
Energy-related emissions
CO2 Billion metric tons
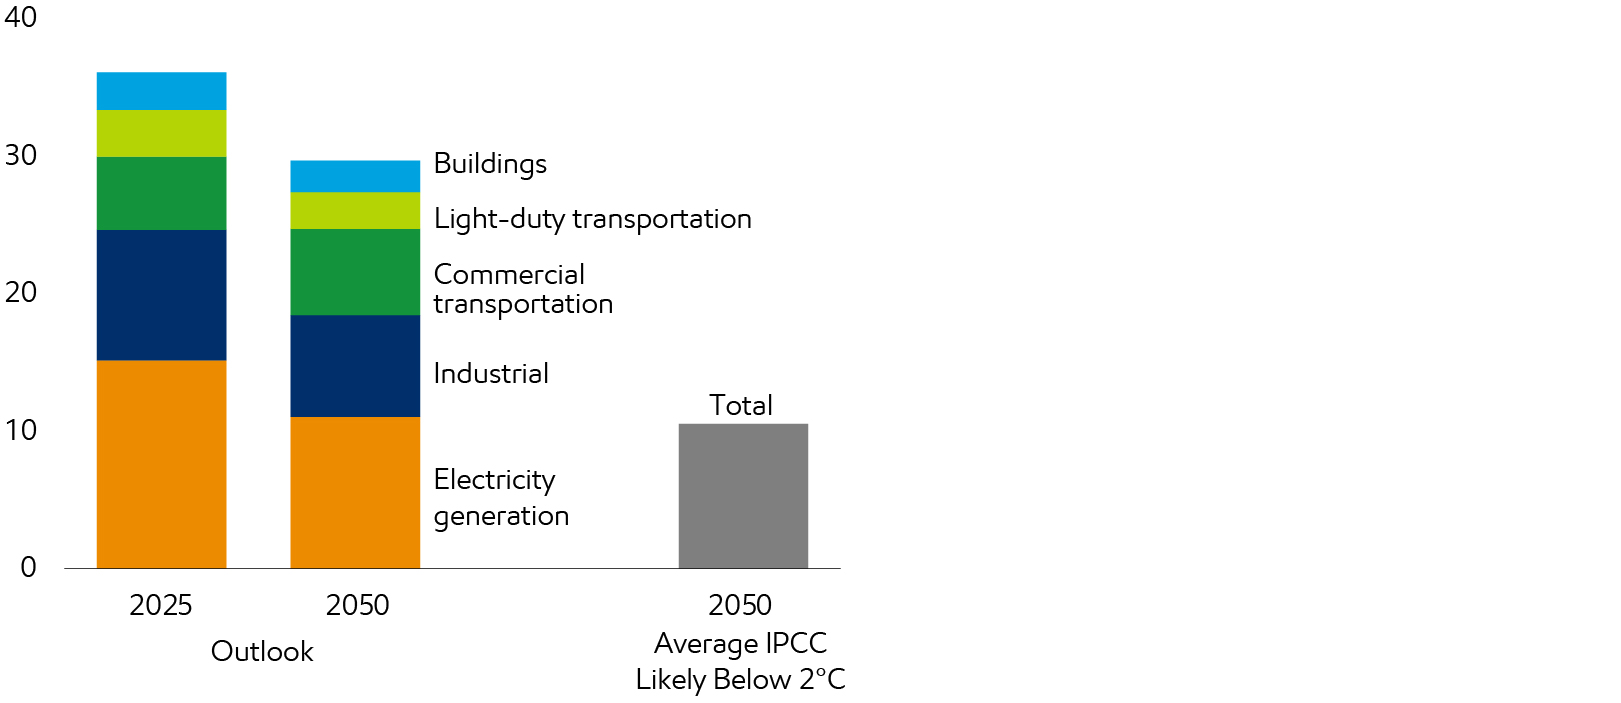
Source: IPCC: AR6 Scenarios Database hosted by IIASA release 1.0 average IPCC C3: “Likely Below 2°C” scenarios; ExxonMobil analysis
Emissions do not contain industry process emissions or land use and natural sinks
The IPCC and our Outlook see the need for both established and emerging technologies to progress faster, in some cases at an unprecedented buildout.
Solutions deployed in IPCC pathways
Quadrillion Btu growth 2020 to 2050
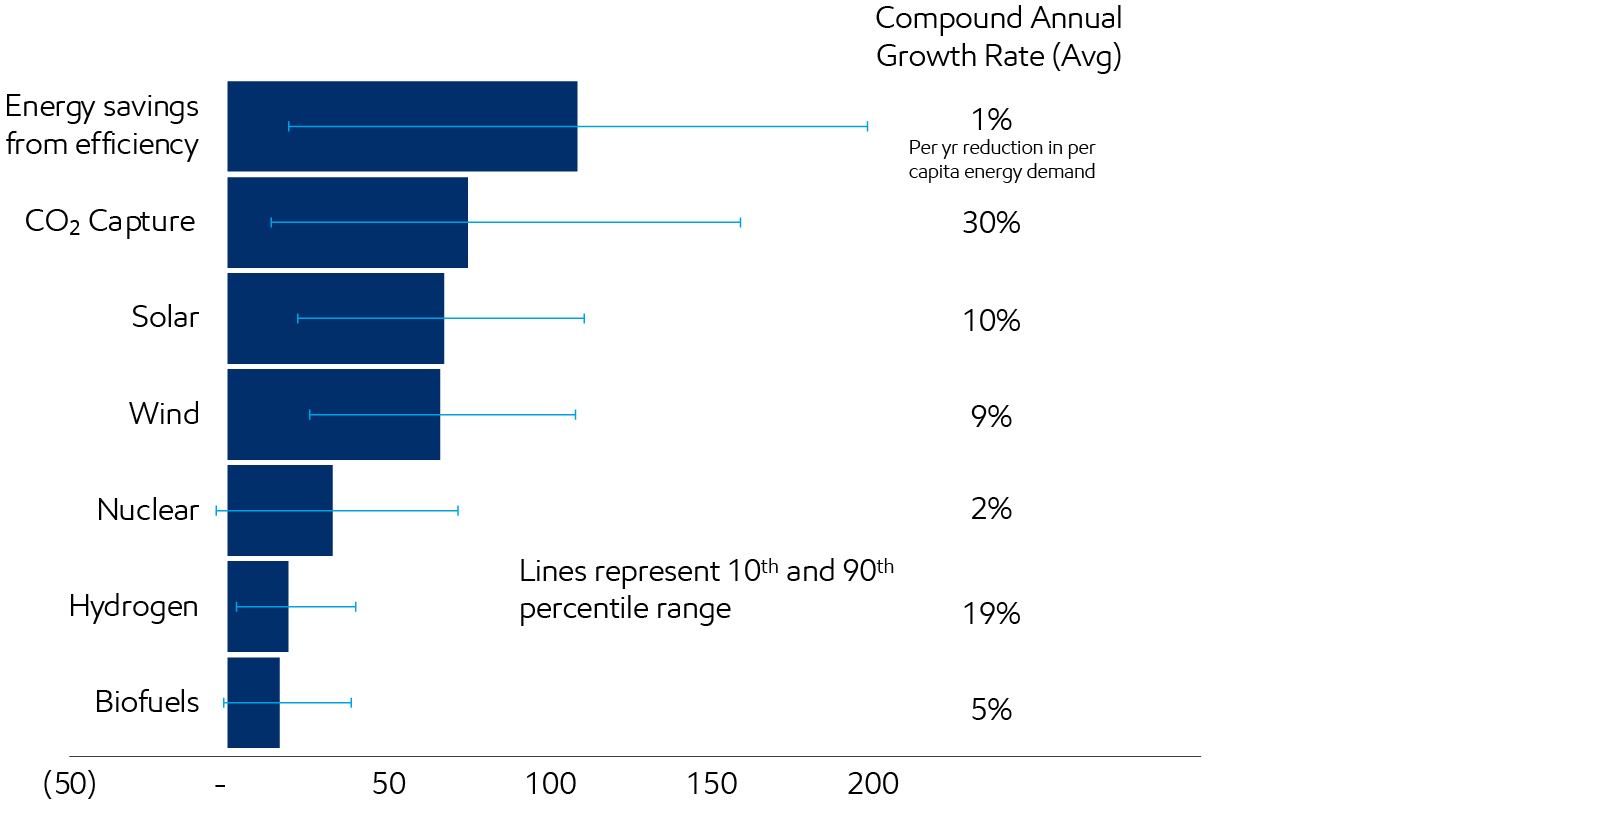
Source: IPCC: AR6 Scenarios Database hosted by IIASA release 1.0 average IPCC C3: “Likely Below 2°C” scenarios; ExxonMobil analysis; Growth from 2020-2050 across the average IPCC Likely Below 2°C scenarios; uncertainty bars represent 10th percentile and 90th percentile scenarios
For example, the IPCC’s Likely Below 2°C scenarios suggest that wind and solar need to grow at an average of 10% per year from 2020-2050, which is broadly in line with recent history. However, carbon capture and storage needs to grow at more than 30% per year through 2050 to meet the IPCC’s Likely Below 2°C scenarios. CCS is not the only technology that will need to be accelerated on an immense scale. Low-carbon hydrogen and biofuels will need to play a much larger role as well.
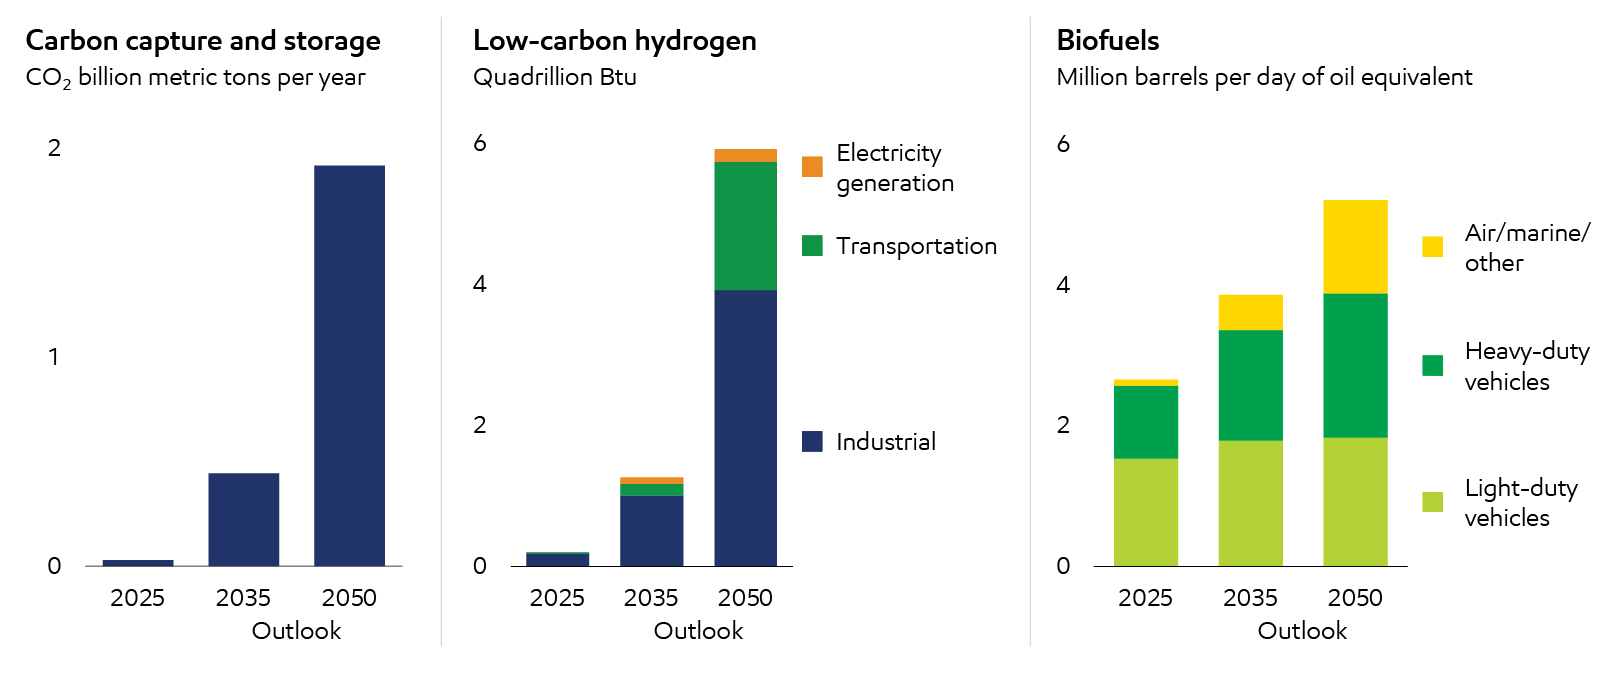
Our Outlook projects that CCS, H2, and biofuels will increase ~70x, 30x, and 2x, respectively by 2050 vs. current levels; however, this is still below the level required in the IPCC Likely Below 2°C scenarios due primarily to a lack of policy support.
Why are CCS, hydrogen, and biofuels essential for reducing emissions?
We know that energy use will increase by 2050 to support a much larger population and economic growth. We also know that fossil fuels remain the most effective way to produce the enormous amounts of energy needed to support commercial transportation, manufacturing and industrial production, due to their high energy density and ease of transport. These critical “hard-to-decarbonize” sectors account for ~45% of all CO2 emissions today (including process emissions, excluding indirect emissions from electricity use).
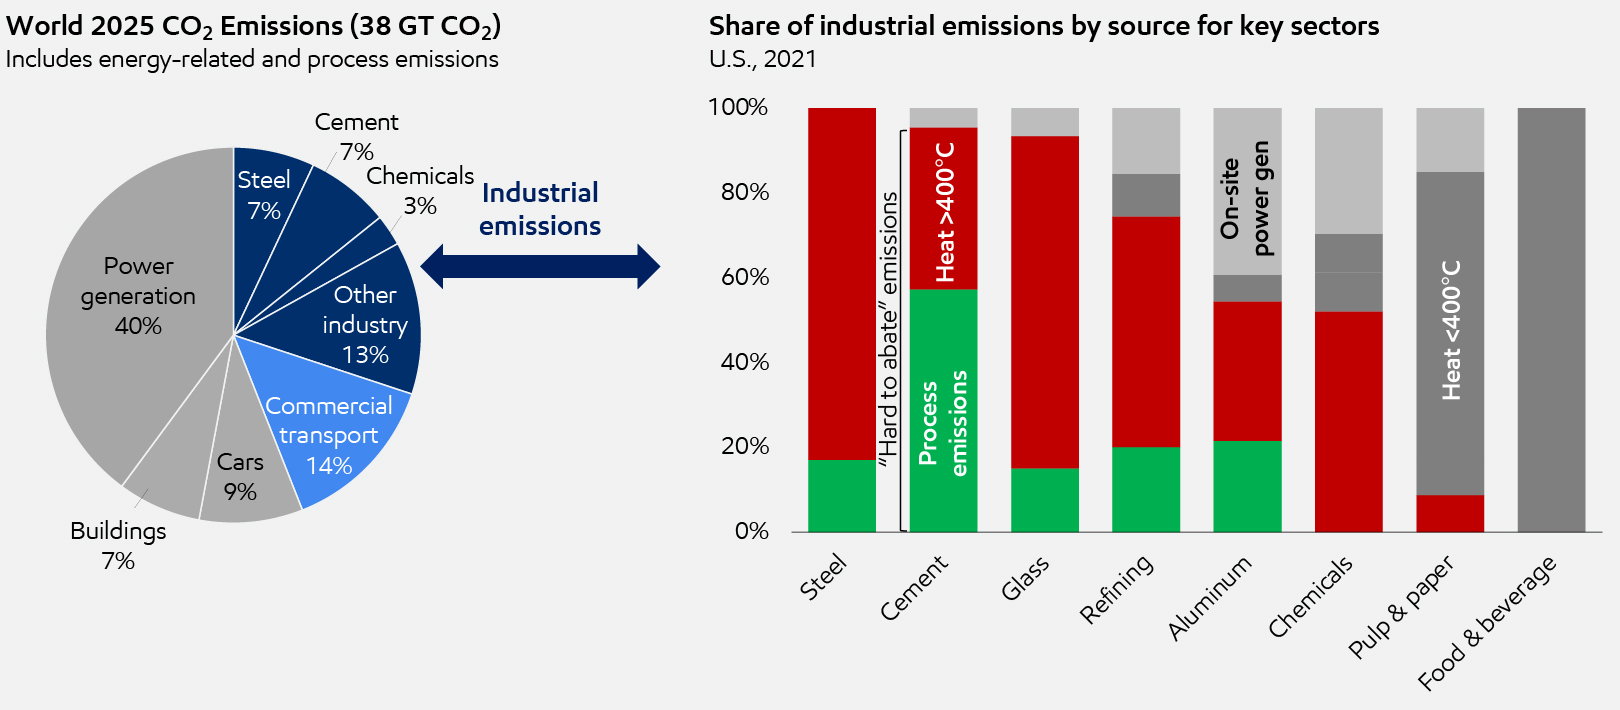
Source: U.S. Department of Energy Liftoff Reports, 2023; ExxonMobil Analysis
Excludes off-site power generation
Chemicals represents steam cracking
When we say these sectors are “hard-to-decarbonize,” what we also mean is that they are “hard-to-electrify.” Based on the IEA’s assessment, industrial electrification will be primarily for low temperature processes (in many cases <200°C), while energy intensive industries where energy is primarily used for generating high-temperature heat will see limited electrification (IEA, 2025). Even in the IPCC Likely Below 2°C scenarios, electricity only accounts for ~40% of final energy consumption by 2050 (vs. ~20% today).
Looking across key industrial sectors, we can see that a significant share of emissions comes from generating heat >400°C (where electricity often isn’t currently a viable alternative) and from process emissions where chemical transformations of raw materials release CO2.
These sectors will require multiple lower-carbon technologies to meet different needs.
- Carbon capture and storage is the process of capturing CO2 emissions at the source and injecting it into deep underground geologic formations for safe, secure, and permanent storage. CCS on its own, or in combination with hydrogen production, is among the few proven technologies that can significantly reduce CO2 emissions from high-emitting sectors, including process emissions.
- Low-carbon hydrogen can replace traditional furnace fuel to decarbonize the industrial sector. Hydrogen and hydrogen-based fuels such as ammonia will be important for decarbonizing commercial transportation as technology improves to lower their cost and policy develops to incentivize the needed infrastructure development.
- Biofuels are expected to play an important role in decarbonizing transportation. Biofuels will be critical in particular for helping to reduce emissions in the aviation industry, which cannot rely on electric batteries for commercial air travel.
Energy transition signposts
Our Signpost process helps us track the rate of deployment of key technologies.
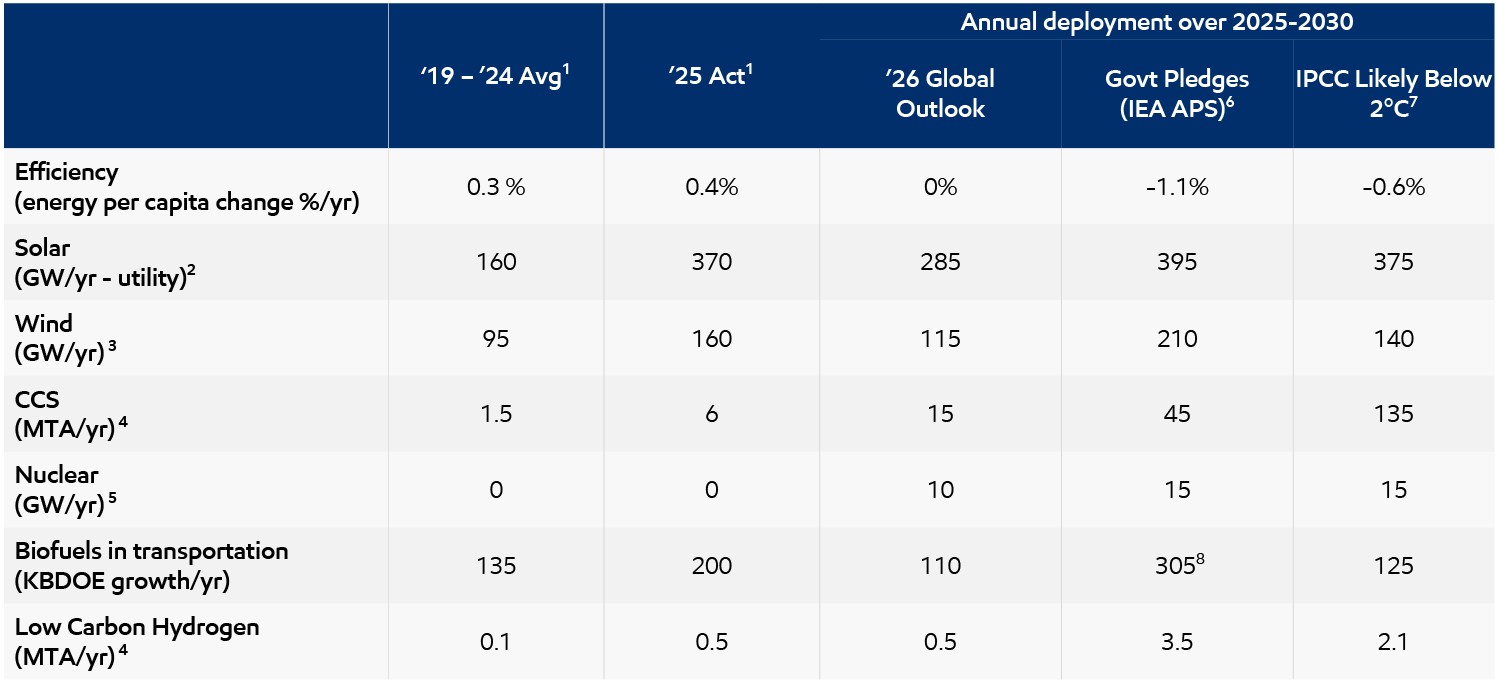
1. Actuals and history based on IEA history file (2025) and ExxonMobil analysis unless otherwise noted
2. Solar is utility solar; solar history from BNEF Solar Tracker (1Q 2026); IEA solar projections converted to utility only based on forecast total solar, applying average historic proportion of commercial scale solar based on BNEF solar tracker
3. Wind capacity deployment history from BNEF Wind Tracker (1Q 2026)
4. Hydrogen and CCS history benchmarked from Wood Mackenzie Project Pipeline database (3Q 2025). CCS capacity for point source CO2 capture (excludes LNG, natural gas processing, and upstream oil & gas production)
5. Nuclear capacity deployment history from IAEA PRIS Database (1Q 2026)
6. APS projection from IEA 2024 World Energy Outlook (Oct 2024) as APS was not updated for 2025 World Energy Outlook
7. IPCC AR6 Scenarios Database hosted by IIASA release 1.0 average of 306 IPCC C3: “Likely Below 2°C” scenarios
8. IEA APS biofuels growth/yr (KBDOE) starts in ‘24 to align with ‘24 World Energy Outlook reporting
These signposts provide valuable insight into current trends and what is needed to achieve a range of potential emissions pathways.
- Solar and wind have seen significant acceleration in deployment over recent years, with the largest growth occurring in China.
- Biofuels are also seeing substantial growth driven by both policy and market factors.
- CCS and low-carbon hydrogen are essential technologies in all projections and scenarios, but they have not yet seen widespread deployment due to lack of policy support and market willingness to pay.
It is also clear that while there is a range of potential outcomes for each solution to 2030, all solutions need to increase deployment this decade. This is the case for our Global Outlook, government pledges (as described in IEA APS), and the IPCC Likely Below 2°C scenarios.
What is needed to accelerate emissions reduction?
It has now been over 20 years since the Kyoto protocol came into force and over 10 years since the Paris climate agreement. Yet global energy related CO2 emissions continued to rise at ~1% per year in 2025, a rate that is unchanged from the 20-year average. This suggests a different policy approach may be needed to reach society’s climate goals.
The IPCC scenarios highlight the importance of considering full climate impact when setting emissions targets, not just focusing on the timing of net-zero GHG emissions. In fact, overly focusing on net zero timing has the potential to constrain energy supply, leading to price shocks which can cause consumers to lose confidence in the economy.
IPCC AR6 projected timing to net zero
# of scenarios at net zero CO2 emissions per 5 year interval
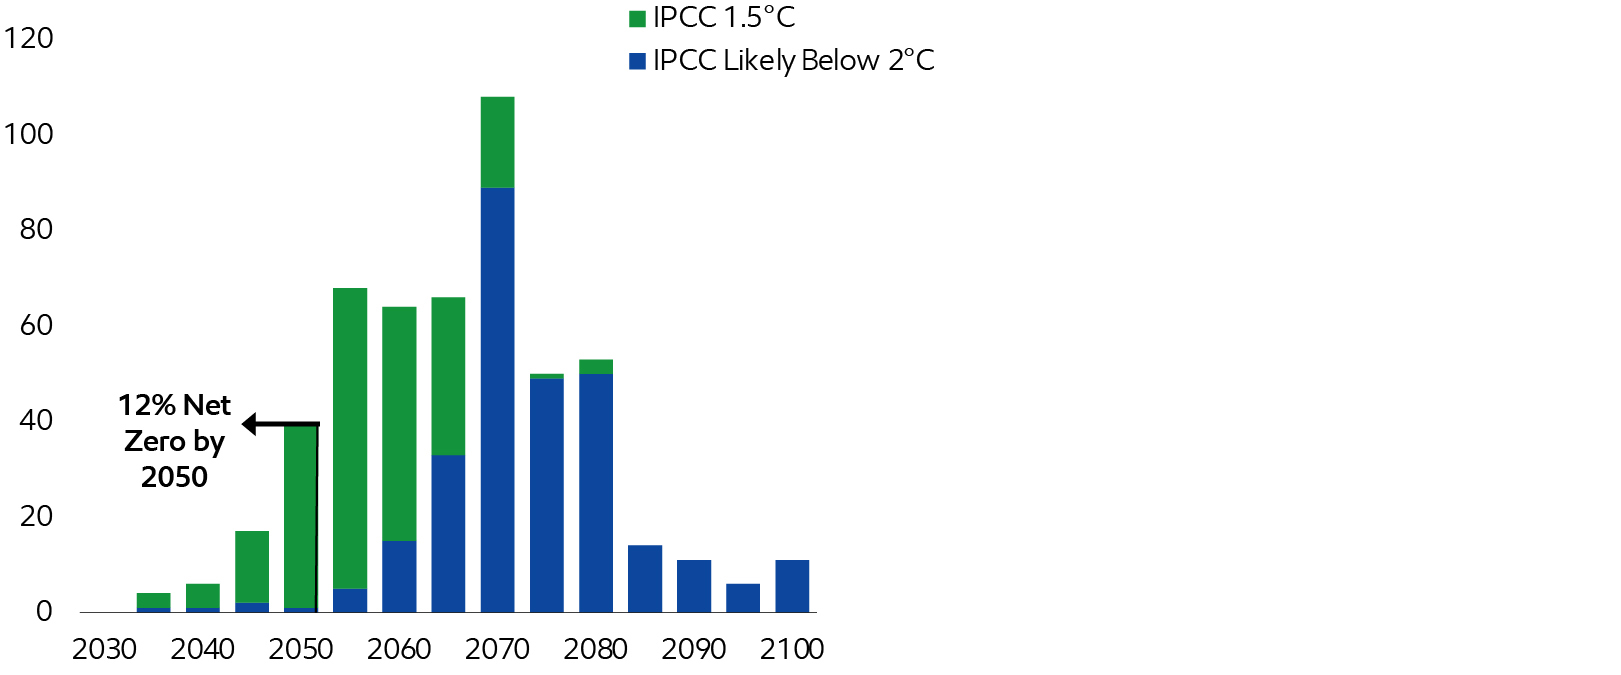
Source: IPCC: AR6 Scenarios Database hosted by International Institute for Applied Systems Analysis (IIASA) release 1.0. IPCC scenarios label C1, C2, and C3; Net zero CO2 emissions: when anthropogenic CO2 emissions are balanced globally by anthropogenic CO2 removals over a specified period; Anthropogenic CO2 means all CO2 (energy-related, process, agriculture, land use). It excludes non-CO2 GHGs (e.g., CH4, CO, F-gases)
Further, there is no single emissions pathway that defines society’s climate goals. Looking at the IPCC Likely Below 2°C scenarios (C3), we see the timing of net-zero emissions ranges from ~2050 to >2100. Similarly for 1.5°C scenarios (C1/C2), we see the net zero timing ranges from ~2035 to 2080.
So, what is needed to affordably achieve society’s climate goals?
- Policy should be designed in such a way to avoid sudden energy price spikes that will reduce consumer confidence AND support long-term economic growth, which is essential to improving long-term affordability.
- Technology advancements & deployment, supported by “all of the above,” technology neutral policy frameworks, will over time reduce technology cost, further improving affordability.
- Market-driven solutions must ultimately develop to naturally select the most cost-effective technologies for companies and consumers.
Want more information? Explore our Advancing Climate Solutions report.
-
Global electricity demand is projected to increase ~65% by 2050
Learn moreThe industrial sector accounts for 40% of electricity demand growth; data centers and electrification of transportation have material impacts in many markets, although there will be significant regional variation.
-
Affordability will drive the pace of any energy transition
Sustained economic growth and continued innovation to reduce costs for key technologies are essential for improving affordability.Learn more
Global Outlook
Explore more



Cautionary statement
The Global Outlook includes ExxonMobil Holdings Corporation’s internal estimates of both historical levels and projections of challenging topics such as global energy demand, supply, and trends through 2050 based upon internal data and analyses as well as publicly available information from many external sources including the International Energy Agency. Separate from ExxonMobil’s analysis, we discuss a number of third-party scenarios such as the Intergovernmental Panel on Climate Change Likely Below 2°C and the International Energy Agency scenarios. Third-party scenarios discussed in this report reflect the modeling assumptions and outputs of their respective authors, not ExxonMobil, and their use and inclusion herein is not an endorsement by ExxonMobil of their results, likelihood, or probability. Work on the Outlook and report was conducted during 2025 and 2026. The report contains forward-looking statements, including projections, targets, expectations, estimates, and assumptions of future behaviors. Actual future conditions and results (including but not limited to energy demand, energy supply, the growth of energy demand and supply, the impact of new technologies, the relative mix of energy across sources, economic sectors and geographic regions, imports and exports of energy, emissions, and plans to reduce emissions) could differ materially due to changes in a number of factors, including: economic conditions, the ability to scale new technologies on a cost-effective basis, unexpected technological developments, the development of new supply sources, changes in law or government policy, political events, demographic changes and migration patterns, trade patterns, trade tariffs and trade sanctions, the development and enforcement of global, regional or national mandates, changes in consumer preferences, escalating geopolitical volatility, including regime changes, war, civil unrest, and other political or security disturbances, including disruption of land or sea transportation routes, decoupling of economies, realignment of global trade and supply chain networks, and disruptions in military alliances and other factors discussed herein and under the heading “Factors Affecting Future Results” in the Investors section of our website at https://corporate.exxonmobil.com/.
The Outlook was published in September 2026. ExxonMobil assumes no duty to update these statements or materials as of any future date, and neither future distribution of this material nor the continued availability of this material in archive form on our website should be deemed to constitute an update or re-affirmation of this material as of any future date. The Global Outlook is a voluntary disclosure and is not designed to fulfill any U.S., foreign, or third party required reporting framework. This material is not to be used or reproduced without the express written permission of ExxonMobil Holdings Corporation. All rights reserved.