ExxonMobil Global Outlook:
Our view to 2050
The Global Outlook is ExxonMobil’s view of demand and supply of energy and related products through 2050.
A foundation of our business plan, the analysis is based on a long-term assessment of:
- Economic trends
- Advances in technology
- Consumer behavior
- Climate-related public policy
Our view to 2050
Key takeaways
All energy types are needed for a more prosperous, lower-emission future.
- Renewables grow the fastest
- Coal declines the most
- Oil & natural gas still make up more than half of the global energy mix
Rising living standards increase energy use 25% in developing countries.
- Half the world’s population currently lacks the energy needed to address basic human needs.
Industry and transport underpin the global economy and will require growing supplies of energy.
Global CO2 emissions fall 25%; affordability will drive the pace of any transition.
Sustained oil and natural gas investment is more important than ever.
Increasing global energy supply AND reducing emissions is not only possible - It’s essential.
-
Developing countries projected to use 25% more energy as living standards improve
>4 billion people currently live in countries where access to energy is below what is needed to address basic human development needs.Learn more -
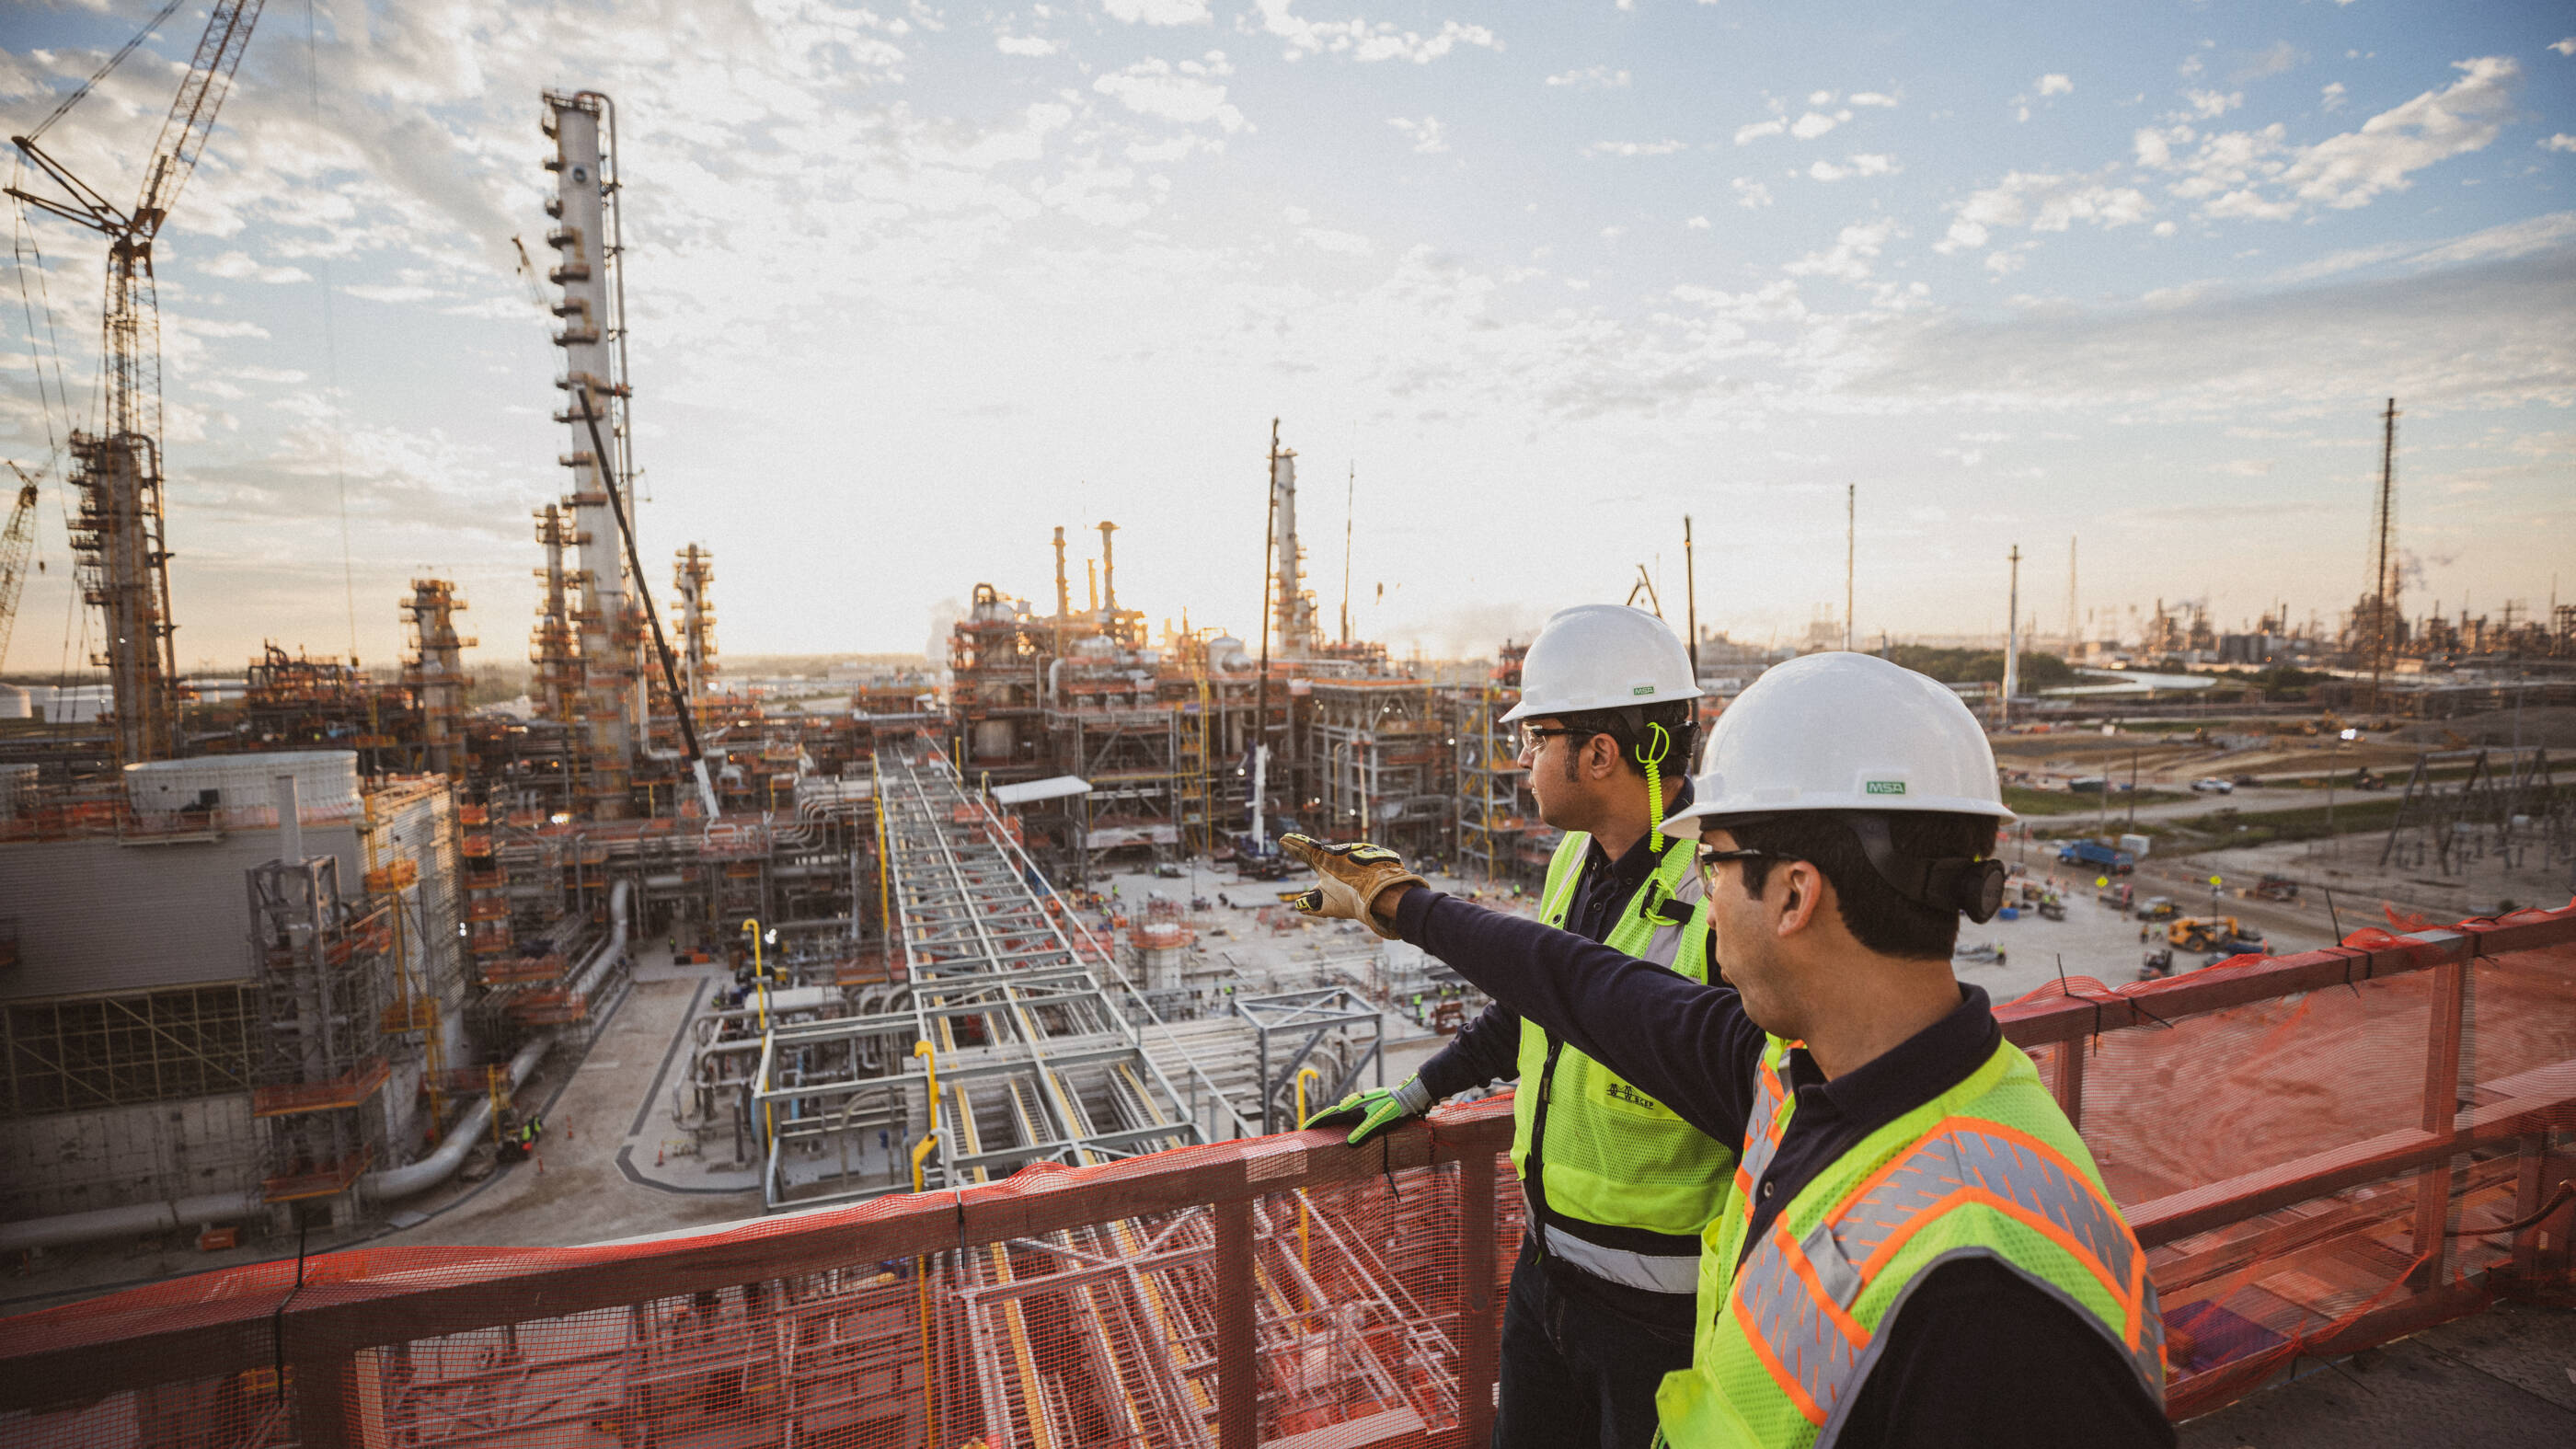
Industry and commercial transportation drive economic growth
These sectors, which make up ~65% of global energy use, have unique needs that cannot be fully replaced with electricity or renewables.Learn more -
CO2 emissions projected to fall 25% by 2050, but more progress is needed
Learn more- Efficiency improvements and renewables are necessary but not a complete solution.
- Technologies like hydrogen, carbon capture and storage, and biofuels have yet to reach their full potential but are needed to reduce emissions on a global scale.
-
Affordability will drive the pace of any energy transition
Sustained economic growth and continued innovation to reduce costs for key technologies are essential for improving affordability.Learn more -
All energy types will be needed
Under any credible scenario, oil and gas remain essential.Learn more -
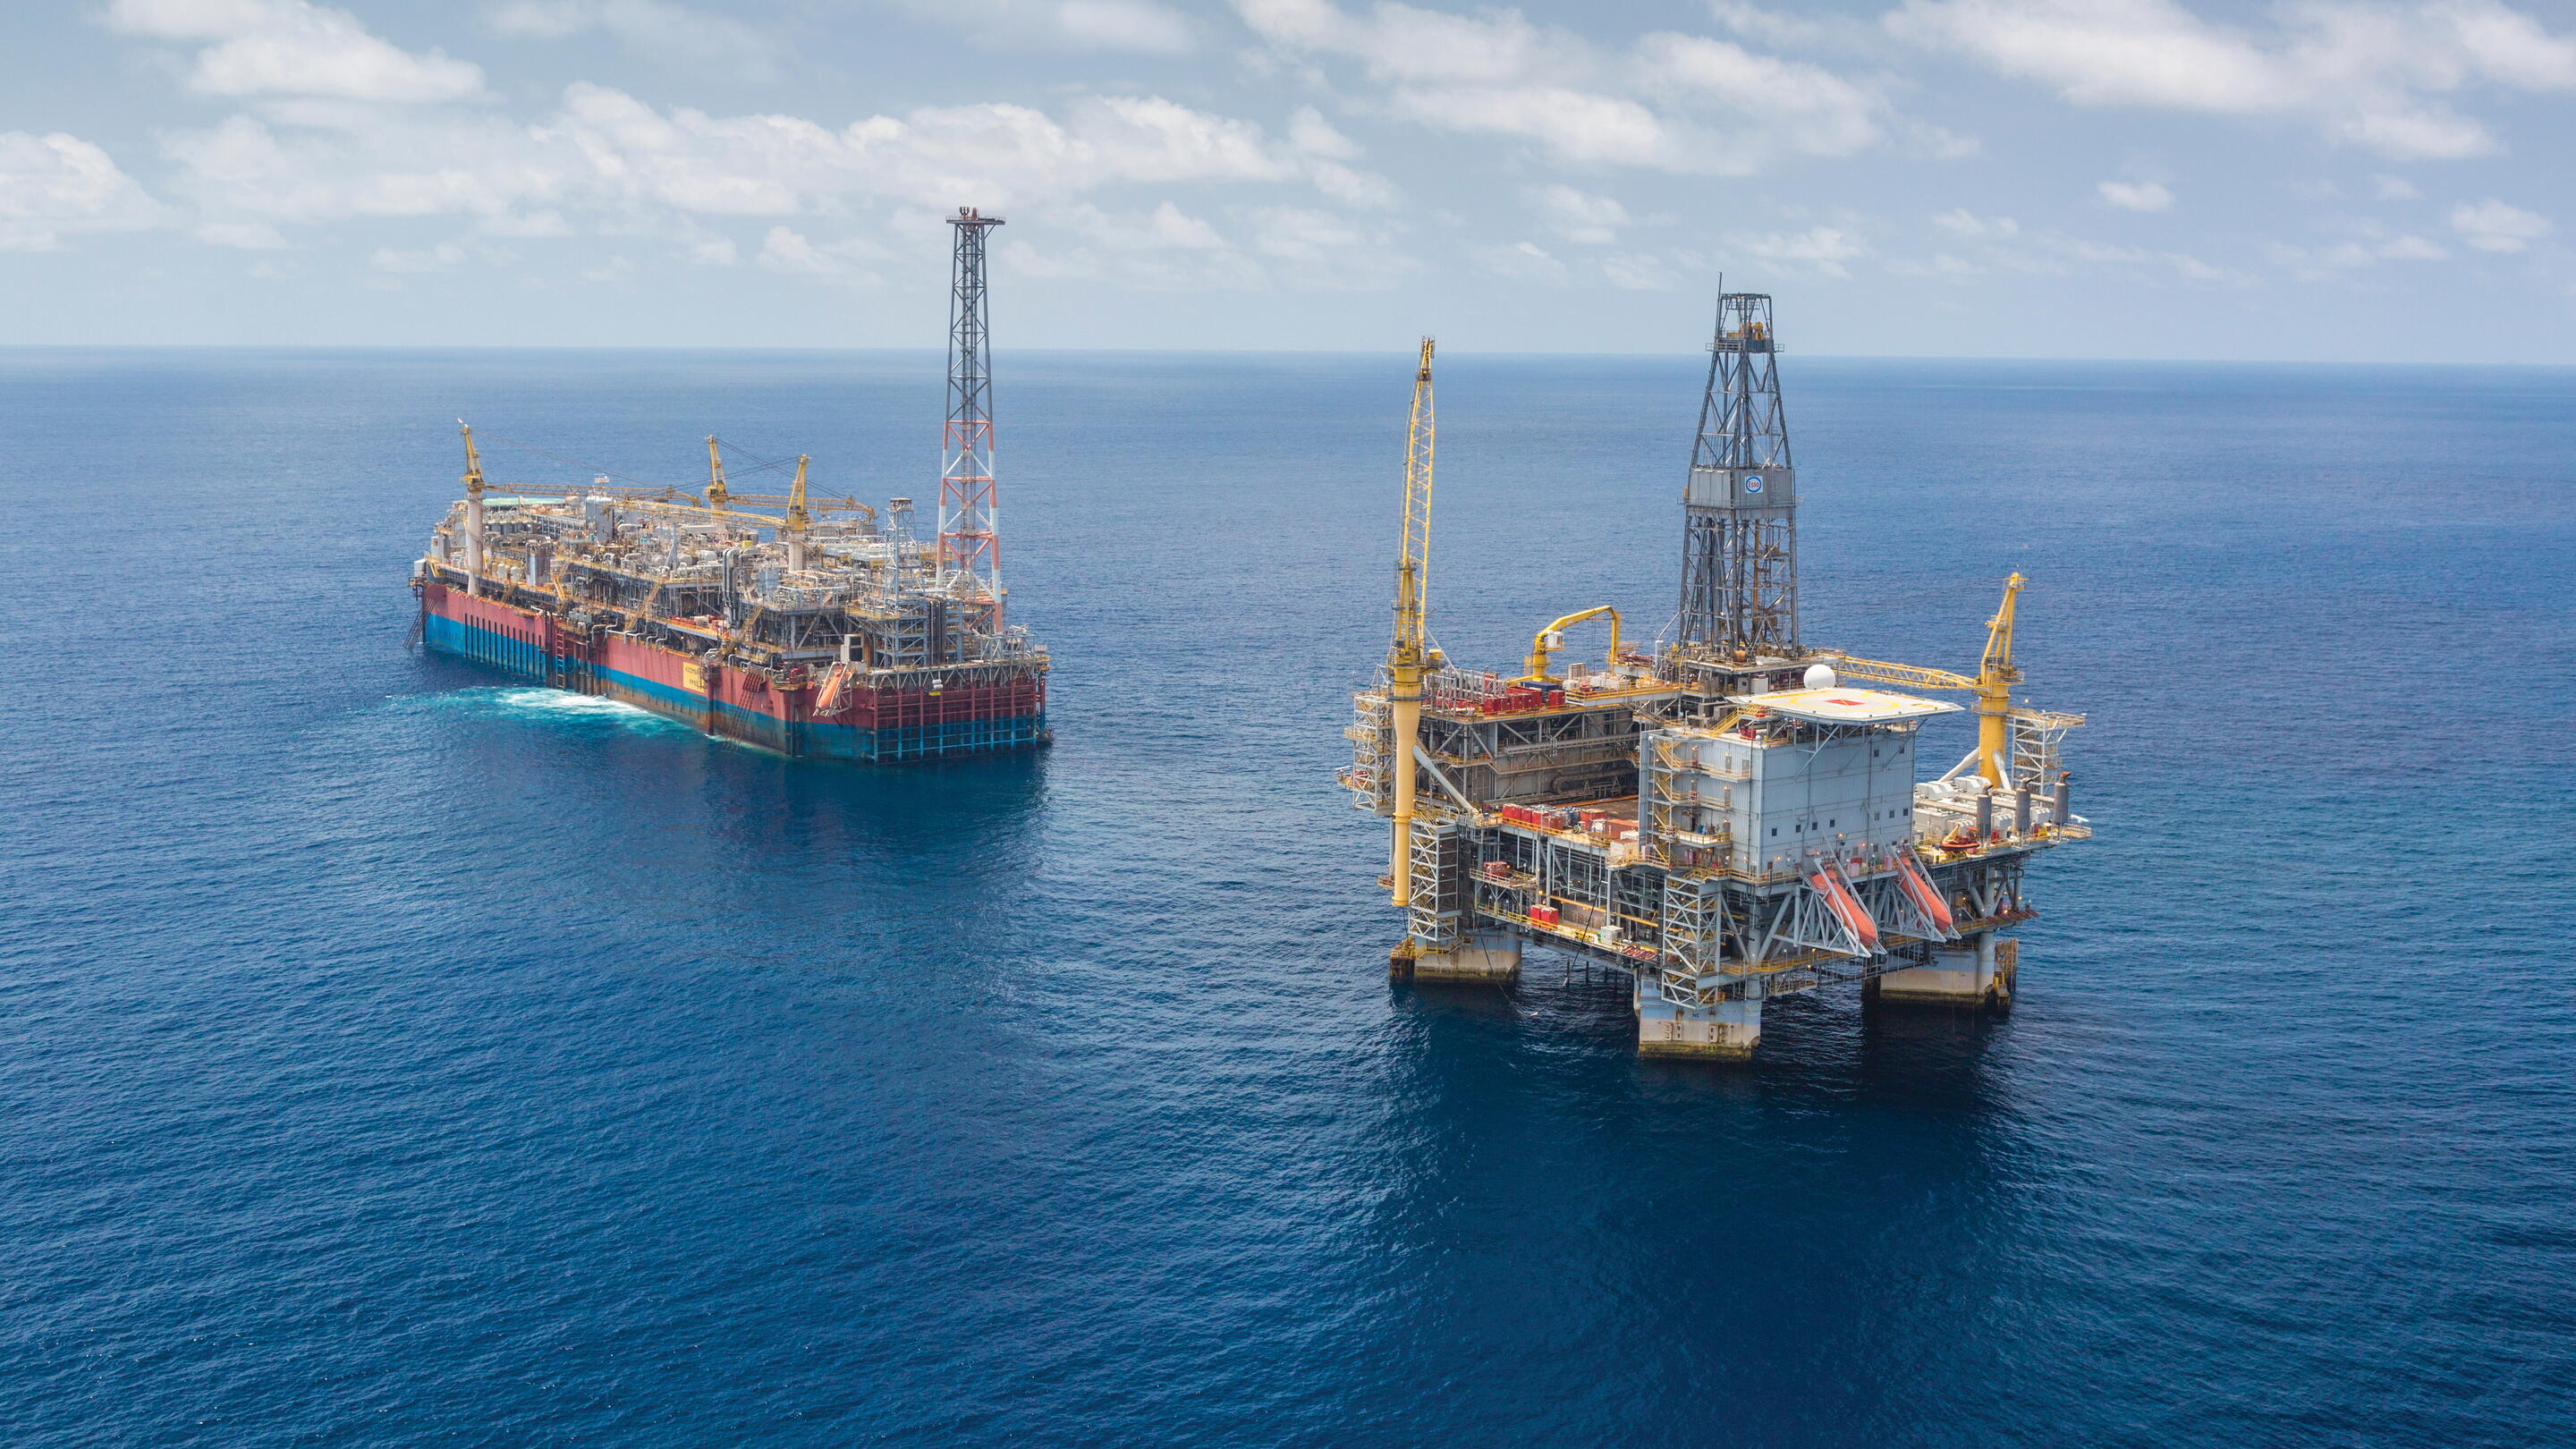
Sustained oil and gas investment is more important than ever
Oil and natural gas supply from producing wells naturally declines over time, which requires investment in new and existing fields to meet demand across scenarios.Learn more
Explore the Global Outlook
Introduction
Report
•
4 min read
• Aug. 28, 2025
Developing countries projected to use 25% more energy as living standards improve
- >4 billion people currently live in countries where access to energy is below what is needed to address basic human development needs.
- Access to sufficient, affordable energy enables economic development.
- Efficiency gains from new technology help slow energy growth from rising prosperity and a growing population.
Report
•
4 min read
• Aug. 28, 2025
Industry and commercial transportation drive economic growth
- Industry and manufacturing are critical to the global economy and modern living standards.
- Global commerce relies on efficiently moving goods and services across and between continents.
- These sectors, which make up ~65% of global energy use, have unique needs that cannot be fully met with electricity or renewables.
Report
•
3 min read
• Aug. 28, 2025
CO₂ emissions fall 25% by 2050, but more progress is needed
- Efficiency improvements and renewables are necessary but not a complete solution.
- Technologies like hydrogen, carbon capture and storage, and biofuels have yet to reach their full potential but are needed to reduce emissions on a global scale.
- With the right policies and technology advancements, these solutions can help society move closer to achieving its climate goals.
- There are multiple potential emissions pathways to achieve society’s climate goals, giving policy makers an opportunity to balance affordability and emissions reduction.
Report
•
5 min read
• Aug. 28, 2025
Affordability will drive the pace of any energy transition
- The cost of energy and essential products borne by consumers will be a critical factor in the pace of any energy transition.
- Lower-emissions solutions are generally more expensive and not affordable for many consumers, especially in developing economies with lower disposable income.
- Sustained economic growth and continued innovation to reduce costs for key technologies are essential for improving affordability.
Report
•
2 min read
• Aug. 28, 2025
All energy types will be needed
- Oil is projected to remain the largest source of primary energy, as it is essential for industrial manufacturing, including as a raw material, and commercial transportation.
- Natural gas demand is projected to rise, largely to help meet increasing needs for electricity and lower-emission industrial heat.
- Lower-emission energy sources, including solar, wind, and biofuels, are expected to have the fastest rate of increase.
- By 2050, the world is expected to use 35% less coal than it does today as lower-emission sources meet an increasing share of rising demand in the developing world.
Report
•
4 min read
• Aug. 28, 2025
Sustained oil and gas investment is more important than ever
- Oil and natural gas supply from producing wells naturally declines over time, which requires investment in new and existing fields to meet demand across scenarios.
- Technology is a key enabler for improved recovery from both new and existing fields.
- LNG market projected to double by 2050 as global gas demand grows.
Report
•
5 min read
• Aug. 28, 2025
About the ExxonMobil Global Outlook
Report
•
3 min read
• Aug. 28, 2025
Projections vs. scenarios
Report
•
2 min read
• Aug. 28, 2025
References and supplemental information
Report
•
5 min read
• Aug. 28, 2025
2025 Global Outlook glossary
Report
•
5 min read
• Aug. 28, 2025Publications
Explore more


Cautionary statement
The Global Outlook includes Exxon Mobil Corporation’s internal estimates of both historical levels and projections of challenging topics such as global energy demand, supply, and trends through 2050 based upon internal data and analyses as well as publicly available information from many external sources including the International Energy Agency. Separate from ExxonMobil’s analysis, we discuss a number of third-party scenarios such as the Intergovernmental Panel on Climate Change Likely Below 2°C and the International Energy Agency scenarios. Third-party scenarios discussed in this report reflect the modeling assumptions and outputs of their respective authors, not ExxonMobil, and their use and inclusion herein is not an endorsement by ExxonMobil of their results, likelihood or probability. Work on the Outlook and report was conducted during 2024 and 2025. The report contains forward-looking statements, including projections, targets, expectations, estimates and assumptions of future behaviors. Actual future conditions and results (including but not limited to energy demand, energy supply, the growth of energy demand and supply, the impact of new technologies, the relative mix of energy across sources, economic sectors and geographic regions, imports and exports of energy, emissions and plans to reduce emissions) could differ materially due to changes in a number of factors, including: economic conditions, the ability to scale new technologies on a cost-effective basis, unexpected technological developments, the development of new supply sources, changes in law or government policy, political events, demographic changes and migration patterns, trade patterns, the development and enforcement of global, regional or national mandates, changes in consumer preferences, war, civil unrest, and other political or security disturbances, including disruption of land or sea transportation routes; decoupling of economies, realignment of global trade and supply chain networks, and disruptions in military alliances and other factors discussed herein and under the heading “Factors Affecting Future Results” in the Investors section of our website at Exxon Mobil Corporation | ExxonMobil
The Outlook was published in August 2025. ExxonMobil assumes no duty to update these statements or materials as of any future date, and neither future distribution of this material nor the continued availability of this material in archive form on our website should be deemed to constitute an update or re-affirmation of this material as of any future date. The Global Outlook is a voluntary disclosure and are not designed to fulfill any U.S., foreign, or third-party required reporting framework. This material is not to be used or reproduced without the express written permission of Exxon Mobil Corporation. All rights reserved.