Report
8 min read
• May 5, 2026Rational and constructive policy
- The world’s climate policies continue to fall short in meeting their emissions reduction aspirations and promoting affordable, accessible, and secure energy.
- The root cause for much of this failure is that far too many policies are designed with the misguided belief that the only way to fully address climate change is to stop the production and use of oil and gas.
- It’s long past time for rational and constructive policies that encourage the full range of technologies to meet society’s needs, incentivize energy production to meet growing demand, and drive down emissions by establishing durable markets for lower-emission products.
- A ledger-based carbon emissions accounting framework that reliably tracks CO2 emissions is needed to compare products’ carbon intensity and develop market-based approaches that require producers to meet intensity requirements that are, over time, tightened until the desired intensity levels are achieved.
- Product-level standards have been used to solve a multitude of tough societal challenges. When applied to carbon intensity, they will create an efficient, cost-effective marketplace for products with lower emissions intensity that can be adjusted to accommodate different economic realities on a country-by-country or region-by-region basis.
Report
8 min read
• May 5, 2026Navigate to:
Framing the challenge
Billions of people around the world still lack access to necessities like clean cooking fuels, electricity for heating, and reliable power for daily life. They’re also striving for what many take for granted, including global connectivity, mobility, and participation in a modern economy.
As people in developing economies improve their standard of living, the demand for energy and products will grow. And yet, many policies around the world are mistakenly focused on reducing emissions by restricting energy supply, either directly or indirectly. While this may, over time, reduce carbon emissions, it will also diminish the quality of life in the developed world and deprive the people of the developing world of any chance at achieving higher living standards.
- ~4 billion people – half the world’s population – lack access to the energy needed for housing, infrastructure, jobs, and basic human needs.1 They live in what can only be called “energy poverty.” Whenever the term a “just energy transition” is used, it cannot ignore how fundamentally unjust this form of poverty – like all poverty – truly is.
- Population growth outpaced access to energy 2020 through 2022 – a trend that reversed in 2023,2 but not at the pace needed to meet U.N. Sustainable Development Goals.3
- Global CO2 emissions from energy combustion and industrial processes are up ~8% over the past decade4 but emissions per person are virtually unchanged.5
- The gap between the commitments countries have made in their nationally determined contributions (NDCs) and the emission reductions called for in IPCC 1.5°C and 2.0°C scenarios continues to grow.6
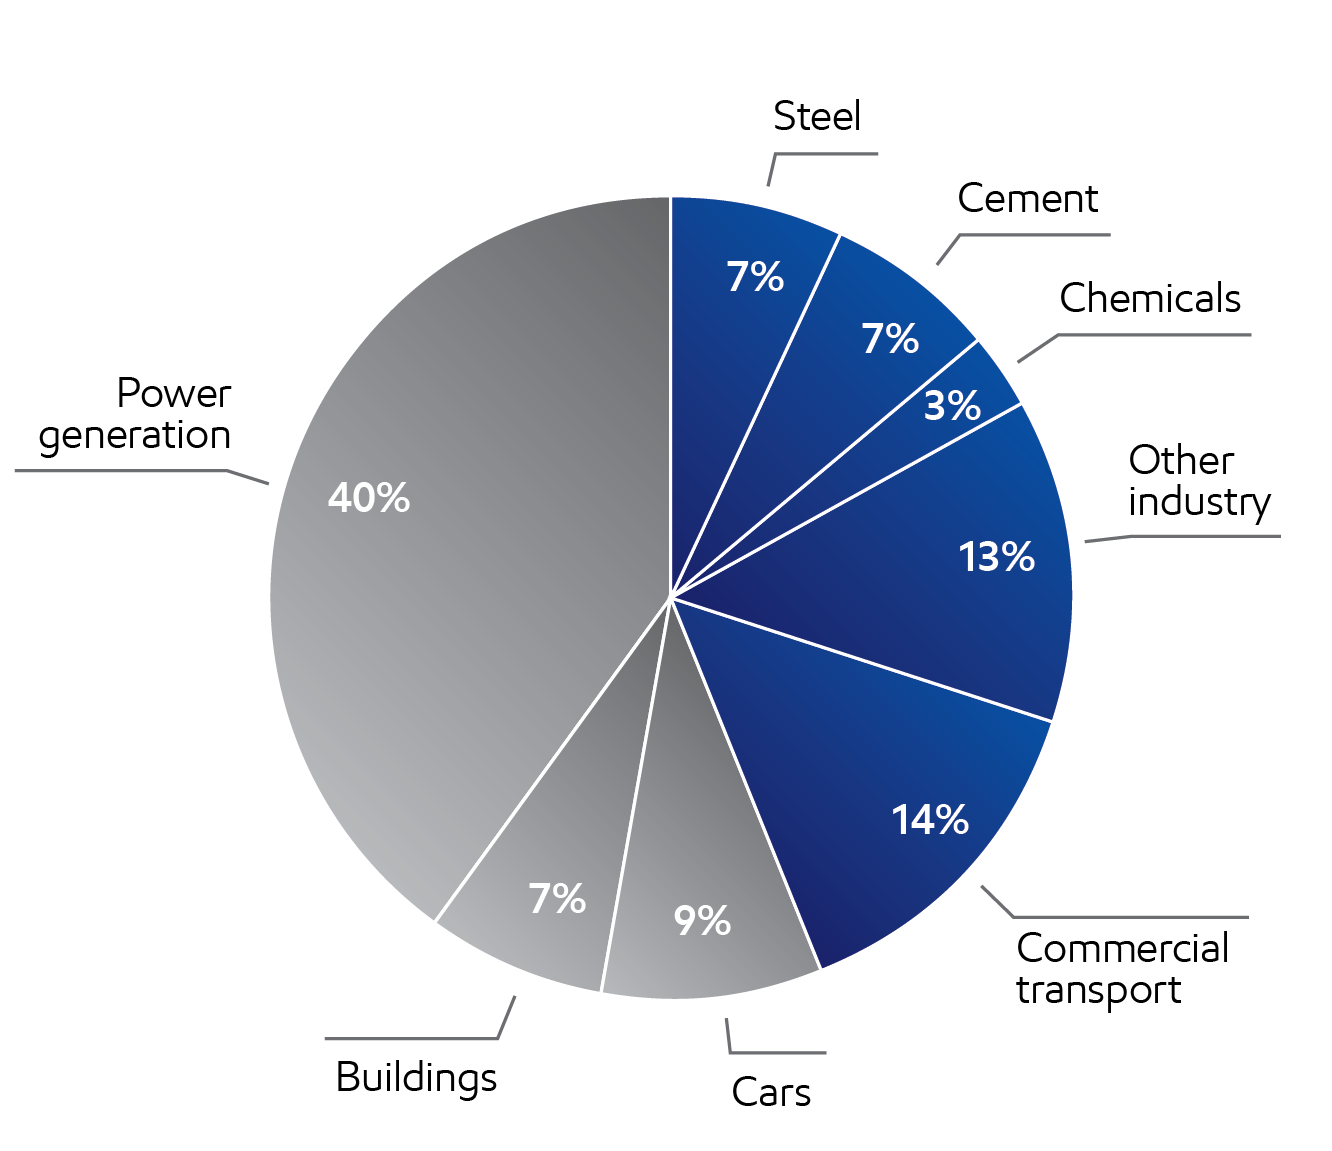
World 2024 CO2 Emissions (37.5 GT CO2)9
Includes energy-related and process emissions
Global energy use has grown ~50% since 2000.7 Our Global Outlook projects continued growth, with higher energy use in developing countries, driven by 1.5 billion more people and a global economy that doubles by 2050 (vs. 2024). On a global basis, energy growth is predicted to slow as efficiency improves but will still increase 12% by 2050 vs. 2024.8
Conclusion: Policies focused on restricting supply cannot meet the challenge of providing enough energy for human development needs.
In the two decades since the Kyoto Protocol, global CO2 levels have continued to rise at a steady pace.10 Significant government subsidies and technological advances have helped wind and solar go from near zero to about 15% of electricity supply, but power generation emissions have still risen about 40%.11 Emissions have also continued rising in the harder-to-decarbonize sectors of industrial manufacturing and commercial transportation, which make up about 45% of global energy-related and process emissions.12
Conclusion: Renewables are an important and growing part of the solution set but cannot unilaterally solve the challenge of lowering emissions at scale, particularly in energy-intensive, harder-to-decarbonize industrial and commercial transportation sectors.
Clearly, a more technologically comprehensive and more politically thoughtful approach is needed.
The carbon emissions accounting gap
The old adage is true: You can’t manage what you can’t measure. Existing methods of reporting carbon have brought focus to emission-intensive industries, supply chains, and entities. But they don’t have the accuracy and fidelity needed to measure the effectiveness of emissions reductions where economic activity actually occurs – at the product level.
Economies run on products – steel for bridges, cement for foundations, and fuels that keep people and goods moving. And the world conducts business at the product level – that’s what drives modern living standards and its associated emissions. Carbon emissions are created but not currently tracked as products move through the economy.
Older frameworks (e.g., the Greenhouse Gas Protocol for Corporations) have helped advance transparency and provided a foundation for voluntary corporate emission reductions. But they were neither designed nor intended to account for emissions at the product and transaction level. Without product‑level accuracy, companies, regulators, and customers cannot distinguish products based on carbon emissions intensity, help to drive durable demand for lower‑carbon products, nor produce workable public policy supportive of this goal.
But there is a practical solution: A ledger-based, carbon emissions accounting (CEA) framework built on the principles of science and financial accounting would allow the world to build markets for lower-emission products, enable efficient global trade, and provide the economic signals needed to unleash innovation for meaningful reductions in CO2 emissions.
Four key benefits of a CEA framework
- Facilitates meaningful comparison of alternatives in business and trade: A consistent carbon emissions accounting standard would empower the market to identify and support the most effective approaches for reducing emissions while still meeting demand for energy and products. With data based on common units, standardized timeframes, set boundaries, and allocation rules at the product level, customers and regulators can incentivize and reward lower carbon intensity products.
- Provides accurate, transparent, and verifiable data – for products and entities: A robust carbon accounting system would be anchored in the physical reality of carbon emissions intensity, with quantification based on chemistry and engineering principles. Emissions would be counted once – when generated – then tracked from business to business through the economy. With full transparency into the methodology, stakeholders would have a clear picture of emissions associated with the products a company buys and sells, as well as any impact on global CO2 emissions versus alternatives. This would be verifiable, decision-grade data that could easily be used to improve, but does not have to replace, the reporting well-established under the GHG Protocol.
- Accelerates decision making with timely measurement: With a functioning CEA framework, information can be available at the product level as entities buy and sell products. This will enable regulators to set product standards that incentivize companies to improve processes and reduce carbon intensity of their operations, their purchases, and their products. This is as opposed to relying on longer-term, backward-looking reports. Producers will have the insights they need to move fast and manage carbon emissions in their operations.
- Incentivizes market solutions by recognizing measurable impact: The framework’s decision‑useful data can steer investment toward solutions that deliver real‑world impact in meeting growing demand with lower-emission options. For example, an LNG producer that increases sales will be willing to show higher entity-level emissions as its lower emission-intensity product replaces higher-emission coal – an alternative that can cut power‑provider emissions by up to 60%.13 CEA provides a consistent methodology to measure reductions and ensure markets drive rational decisions.
This level playing field would help ensure that producers who operate efficiently are not unfairly penalized for their scale. And it would discourage “carbon leakage,” a global trend in which less emission-efficient companies located in less-regulated economies step in to meet demand unmet by forced reduction of more efficient producers and negatively impact global emissions reductions.
Why should a CEA be “ledger-based?”
Societies have tracked economic activity using ledgers for thousands of years. In fact, the earliest examples of “ledger based bookkeeping” appeared even before written language. Clay tablets with systematic, tabulated, and ongoing records of goods, receipts, and disbursements are the first true ledgers in history – and some of the earliest artifacts of civilization.
Double-entry bookkeeping evolved in the 14th century, when merchants needed a reliable way to track complex ventures involving ships, global inventories, and credit. The ledger system improved integrity by making mistakes harder to miss. With today’s automated global accounting, the core benefits of accuracy, transparency, and trust remain the same. These time‑tested principles underpin today’s modern economy across borders and regulatory regimes. They can also be applied to how society tracks and manages carbon emissions.
How ledger-based carbon emissions accounting works
In financial accounting, a ledger is used to record each transaction in order to efficiently track materials and value flowing in and out of an entity. A financial ledger can be as simple as tracking deposits and payments in a personal savings account and as complex as managing millions of transactions for a global business.
While not financial reporting and not treated like financial disclosures, ledger-based carbon emissions accounting works in a similar way.14 Each transaction is recorded in a standard way to account for the stocks and flows of emissions in and out of an entity. Ledger entries are based on a carbon mass balance derived from irrefutable chemistry and engineering principles:
- As carbon enters the entity’s gate via purchases from suppliers, it is recorded in the ledger.
- Emissions generated during production, such as burning natural gas for heat, are recorded in the ledger.
- Emissions associated with the finished products leaving the gate via sales to customers are recorded in the ledger.
Each ledger entry is now a verifiable set of transactions that can be used to calculate both the carbon intensity of the products sold and emissions generated by the entity.
This can work for virtually any product, company, and country.
Example product: Sustainable aviation fuel (SAF) made from soybean oil15
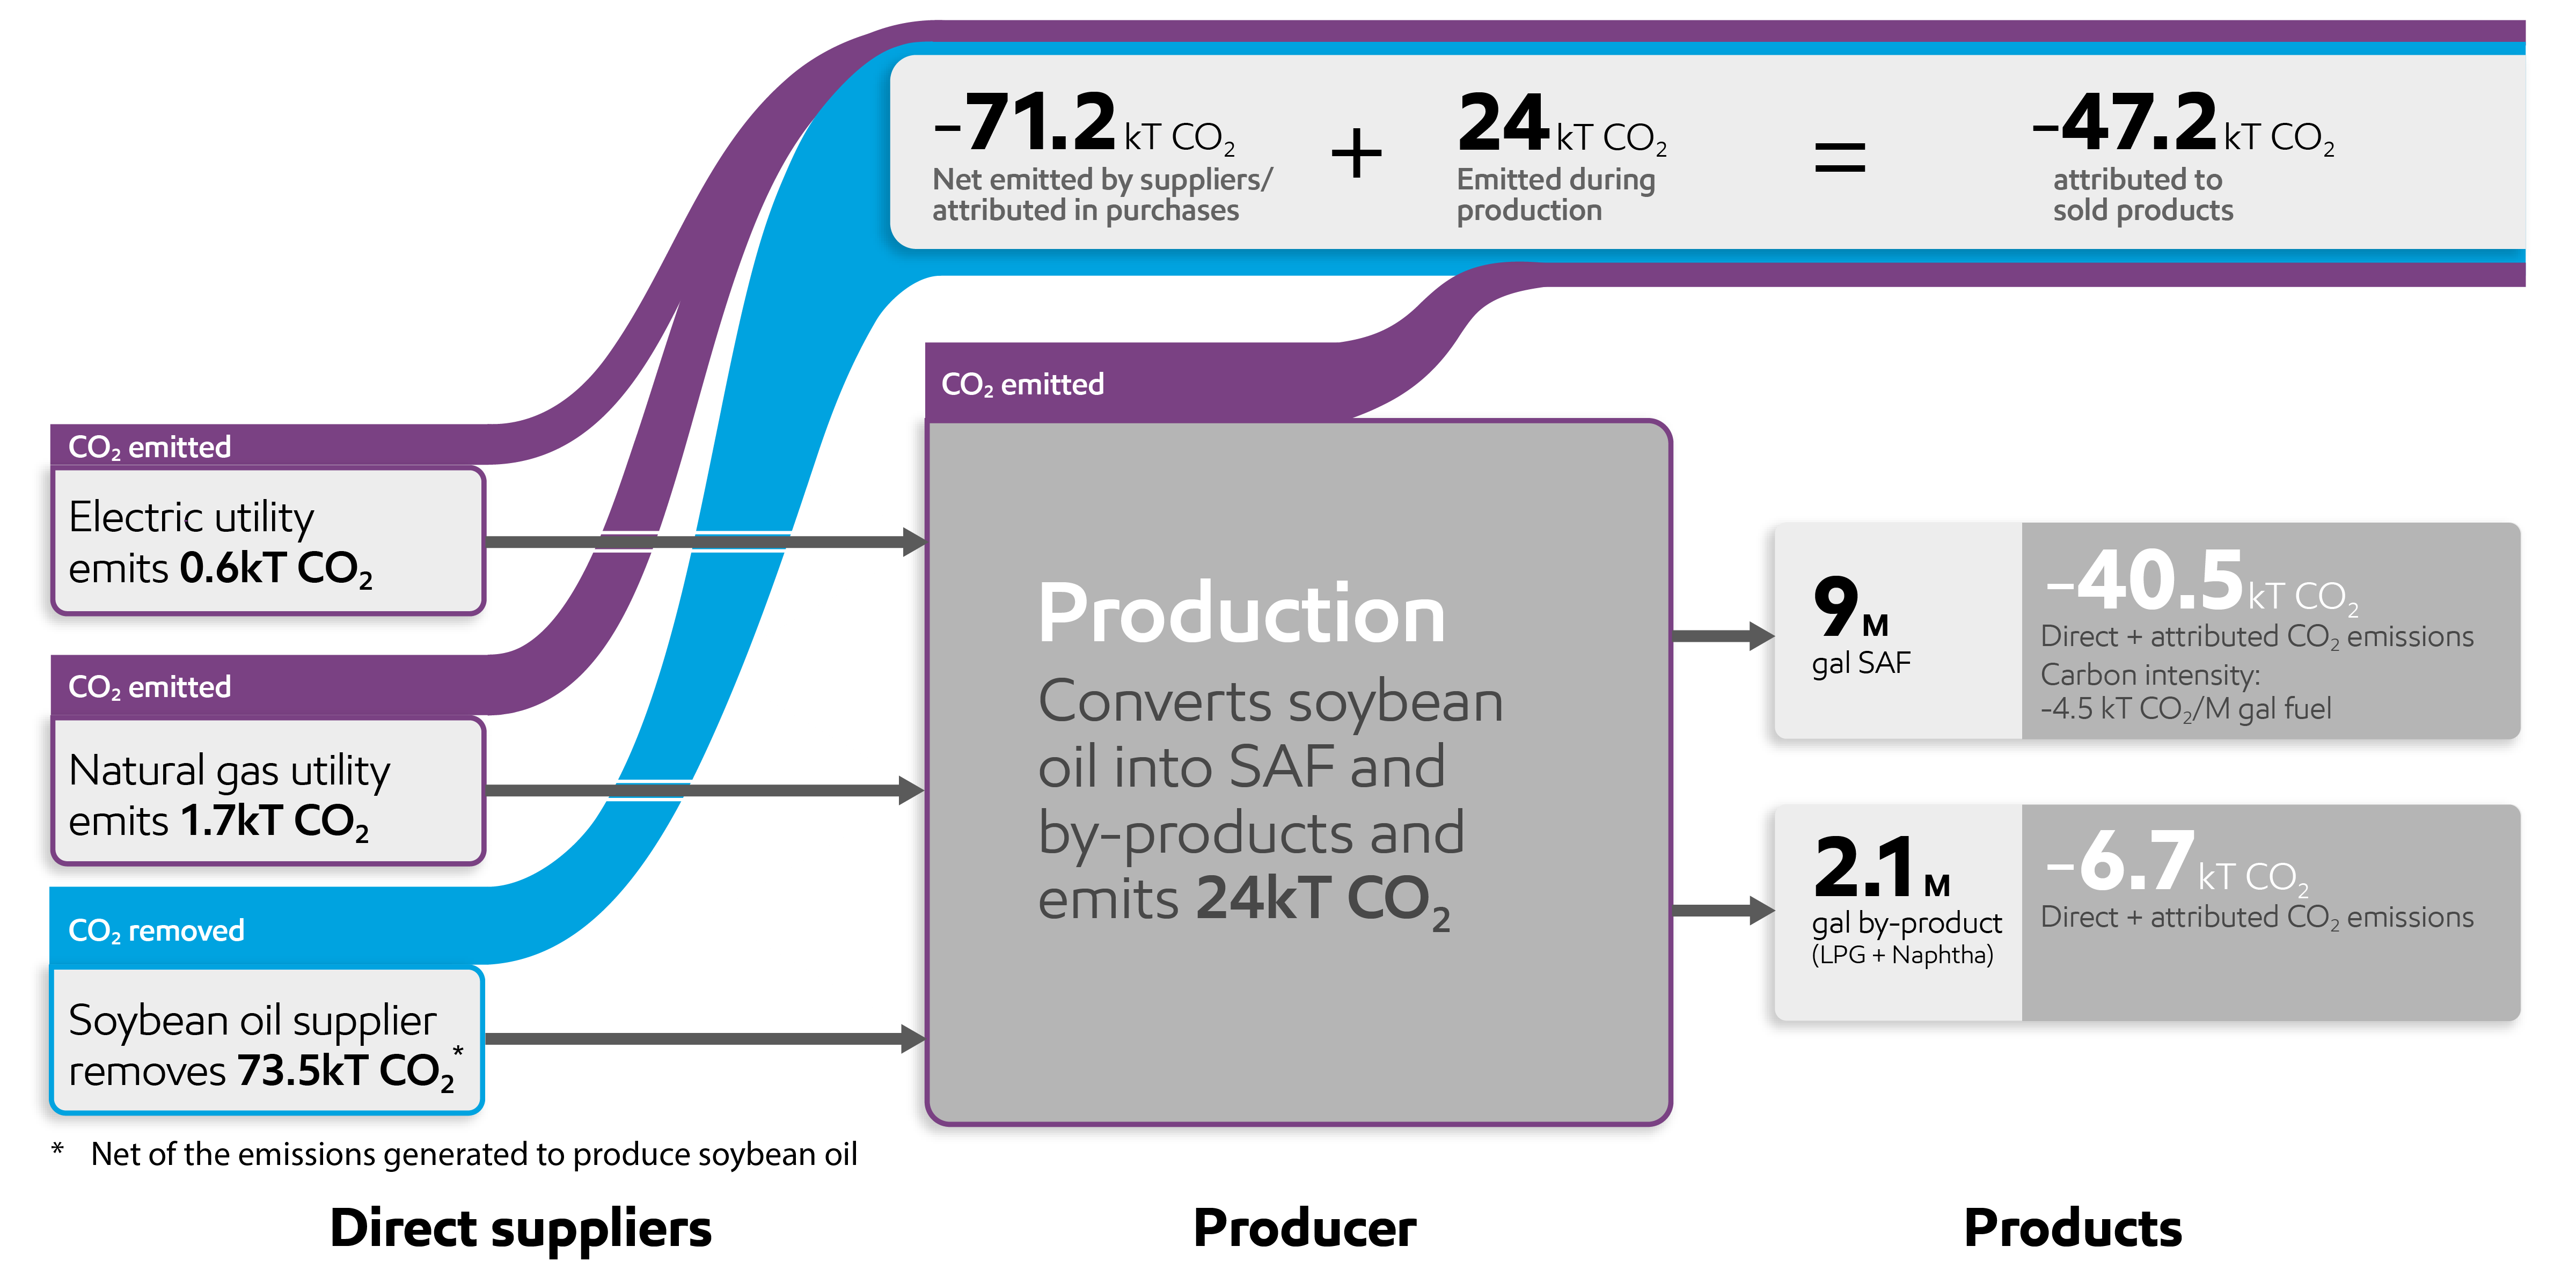
The graphic above and the carbon emissions ledger below show how carbon emissions are rigorously tracked as they transfer through an SAF producer, culminating in the carbon intensities of the products it makes (i.e., SAF and some by-products). In short:
- 2.3 kT of carbon emissions come into the company with the electricity (0.6 kT) and natural gas (1.7 kT) it purchases from suppliers. These are the emissions previously released to the atmosphere by the suppliers.
- A negative amount of carbon emissions (-73.5 kT) comes in with the soybean oil the company purchased as feedstock. The soybean oil is carbon-negative on a life-cycle basis because the soybeans extracted CO2 from the atmosphere during their growth.
- The SAF producer emits 24 kT of direct carbon emissions during manufacturing of the products.
- The carbon intensity of the sustainable aviation fuel (-4.5 kT CO2/Mgal fuel) is tracked based on the volumes produced and transported to the customers, who now have decision-useful data to evaluate the carbon-intensity of options for purchasing fuel.
In its simplest form, the carbon emissions ledger for the SAF producer could look like this:
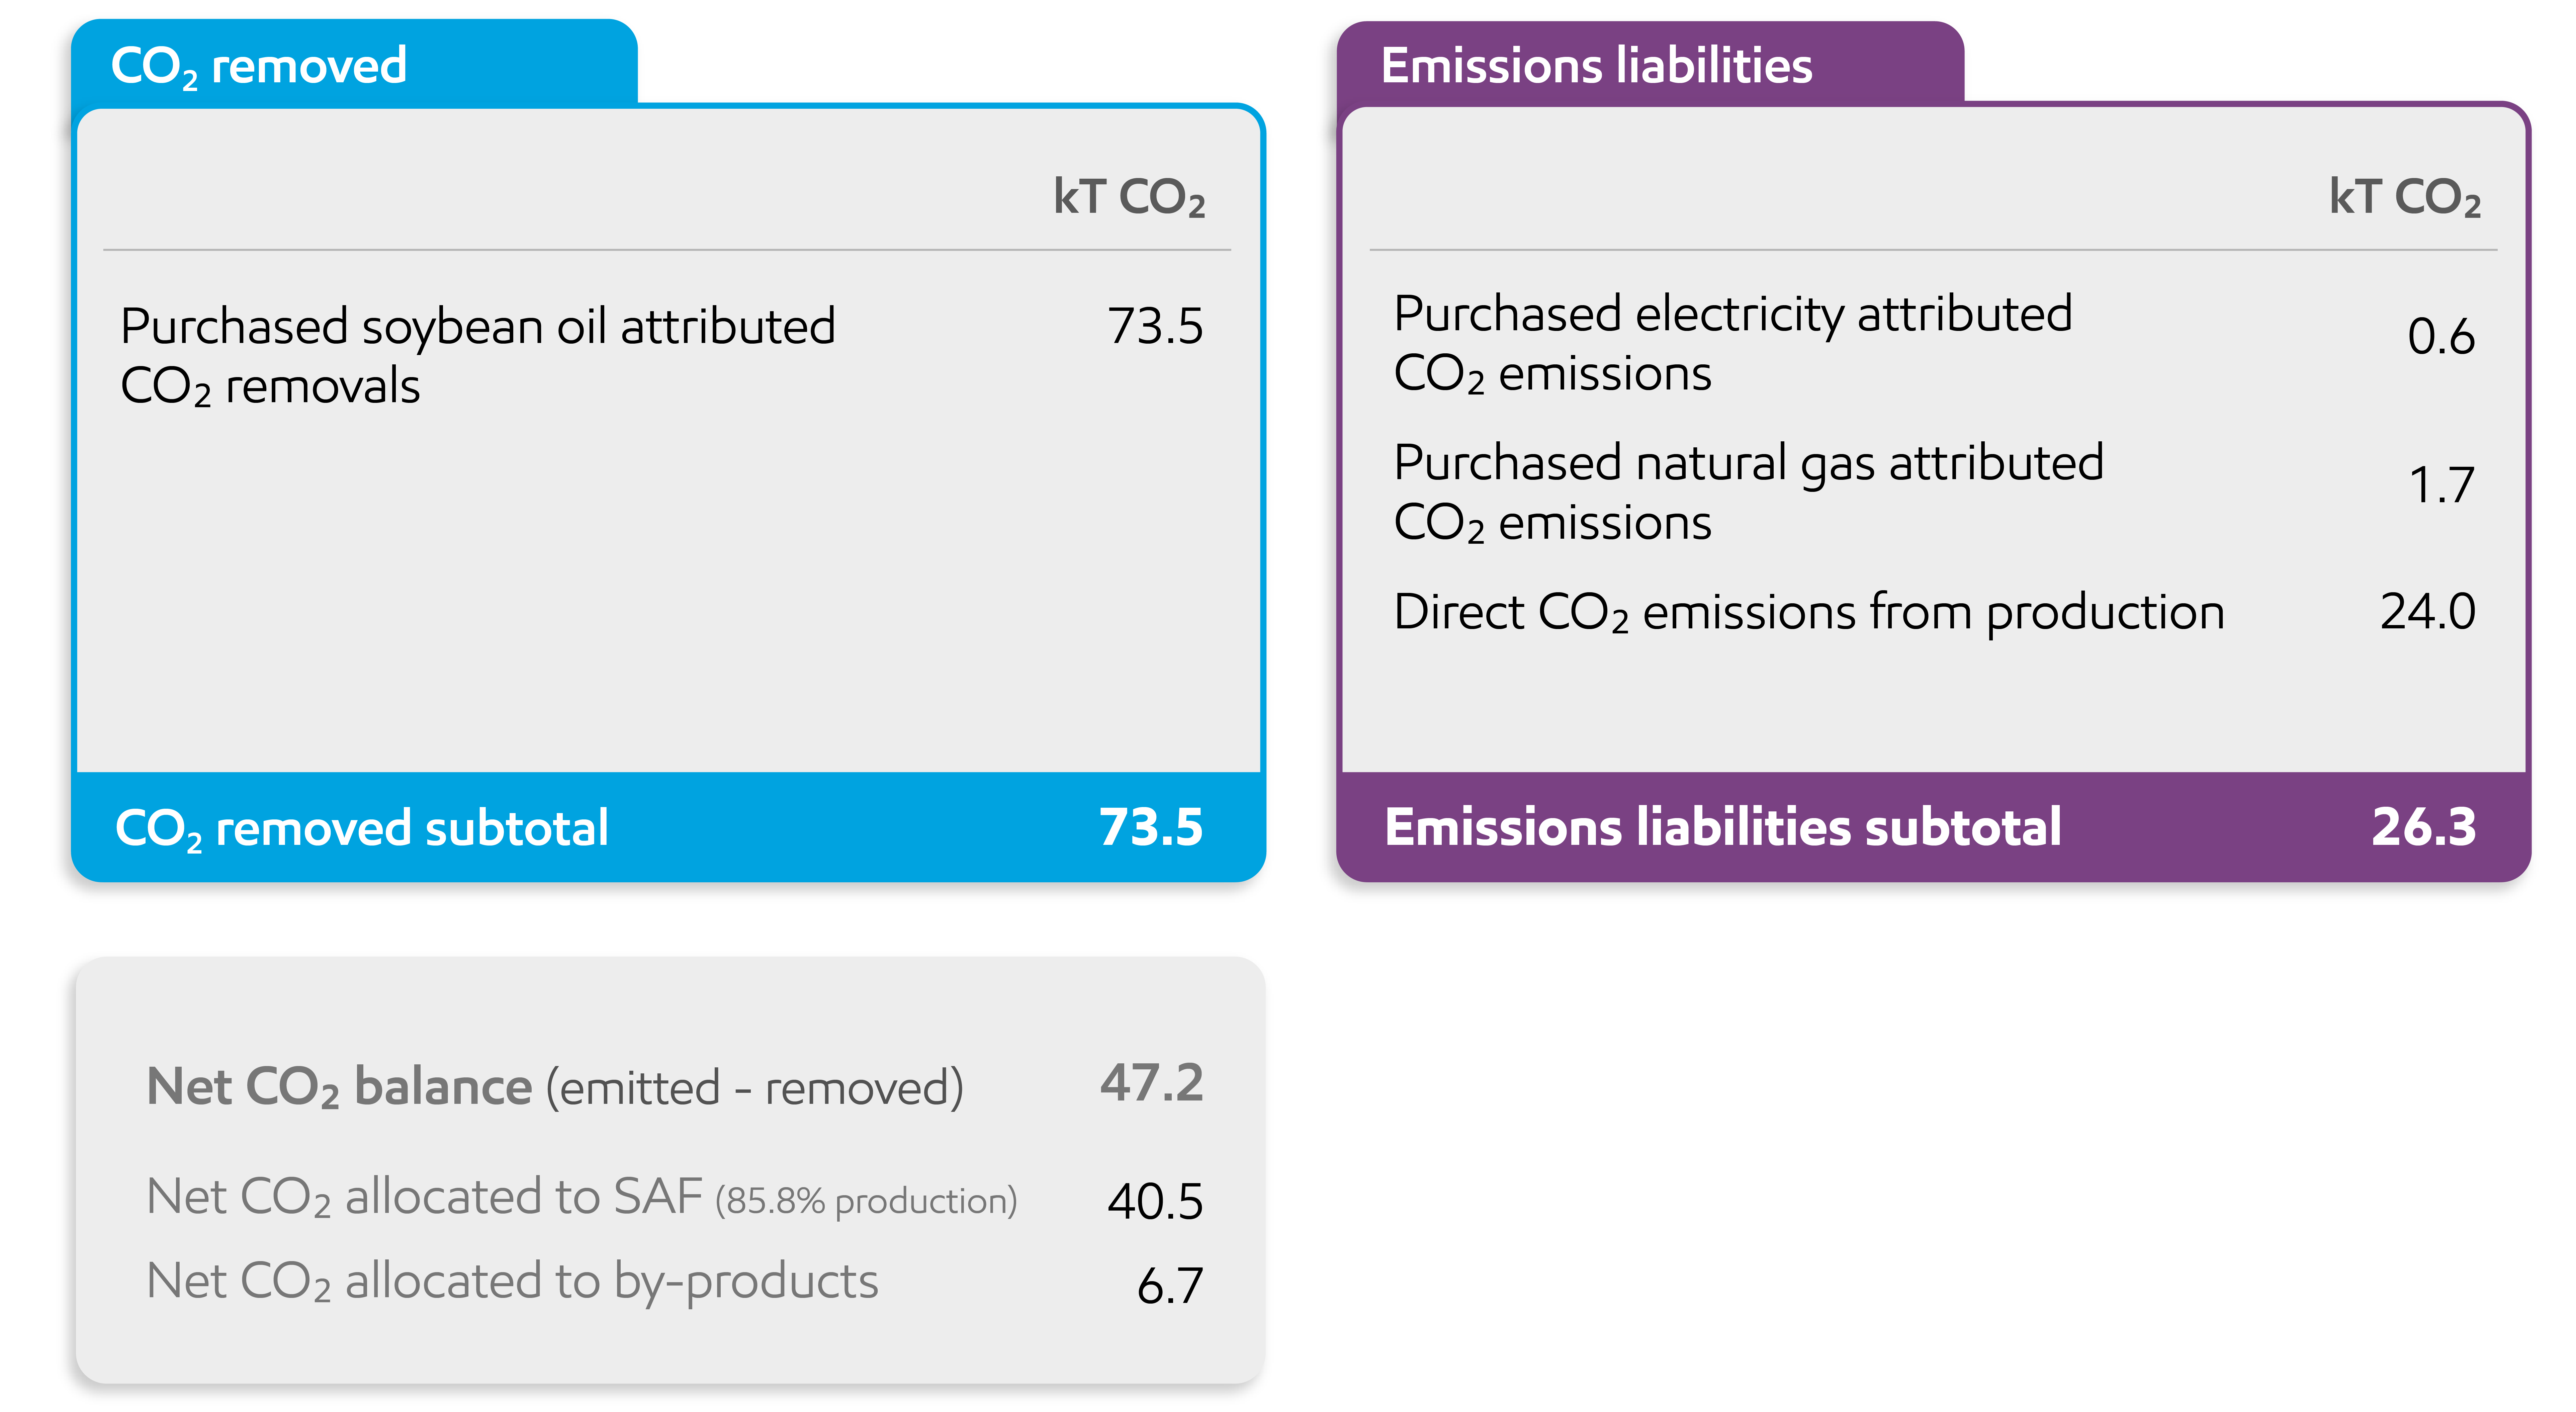
In the example above, you can see CO2 emissions at every stage of the process. It begins with net negative CO2 from the biofeedstock, reflecting its biogenic production cycle that extracted CO2 from the air. This total is based on a life-cycle modeling framework like Argonne US National Lab GREET, developed and maintained by the U.S. Department of Energy. CO2 is then added or subtracted during the production process and then again when the product is sold.
The net CO2 balance on the ledger above shows the carbon emissions associated with the products to be sold to customers. With this information in hand, customers can choose among SAF products and producers, and SAF producers can market their products based on this carbon intensity. Lower carbon intensity becomes a competitive differentiator and, when done at scale, paves the path toward any country’s emission-reduction goals.
As mentioned above, CO2 should only be counted once by the emitting entity and rigorously tracked to understand CO2 contained within products. Net CO2 can then be transferred from suppliers to other entities along the value chain through their transactions. And with this level of detail, producers and others can identify the most efficient points in their value chains to reduce emissions.
A CEA framework should have consistent standards for countries, companies, and products. As noted, this framework could work with others, including aspects of GHG Protocol’s framework, to establish verifiable and product-specific data.
If you can’t accurately account for carbon emissions and reductions, you can’t assign value to the results. Markets need price signals. Regulators need decision-useful disclosures based on reliable data. Without those, the world can’t translate climate policy into real, scalable emissions reductions.
Product-level carbon-intensity standards – a pragmatic approach
Today, countries around the world set thousands of standards for products.16 Products sold into these countries must meet these standards irrespective of where the product is made.
Examples of product standards that have proven effective in harnessing market forces to innovate and lower costs of meeting society’s needs include food safety and efficiency standards on appliances.
These standards work by setting limits on certain product characteristics. They can be tightened over time where supply and technology permit, which incentivizes producers to meet increasingly stringent requirements. They also incentivize competition for suppliers to meet the requirements at lower cost through new technologies, which drives increasingly cost-effective solutions.
Example: Marine fuel
In the 2010s, the International Maritime Organization (IMO) required that the limit for sulfur content in marine fuels be lowered from 3.5% to 0.5%. The feasibility of the change was studied with industry involvement over 10 years. This gave shippers and their suppliers time to consider how to best meet the new standard. A variety of solutions were implemented. They included fuel hydrotreating, alternate feeds to marine fuels, onboard scrubbers, and alternate fuel vessels. In 2020, when the standard became effective, only 55 cases of non-compliance were reported among the 60,000 ships driving global trade, according to the IMO.17
When governments or international bodies have methodically applied effective standards or specifications to individual products or categories of products, without picking technology winners and losers, producers and sellers have efficiently competed to develop products that meet the standard at the lowest price.
Governments can require that products meet carbon-intensity standards to be sold in the market, accounting for supply and technology. They can decide the starting point and how to feasibly make the standard more stringent over time. Market-forming policies help create demand for lower emission-intensity products, and they help encourage producers to invest in decarbonization efforts.
Only 10 essential commodity products make up 70% of global energy emissions.18 Policymakers can start with the products that could drive massive global CO2 emission reductions, such as steel, cement, and aviation fuel. In these cases, even small changes in carbon intensity will have significant impacts at a cost that can be calibrated to not unduly affect the consumer or business it ultimately serves.
Building on the SAF producer example above, the graphic below illustrates how a product carbon‑intensity standard for jet fuel could work in practice. A regulator would set a maximum allowable carbon intensity for any jet fuel sold in the market. Suppliers could then only sell – and customers could only purchase – fuel that meets this limit.
A carbon-intensity standard set at the product level would simplify emissions reductions for regulators, buyers, and sellers
This approach encourages the lowest‑cost emission‑reduction options across the supply chain, including efforts by upstream providers to reduce the carbon intensity of the electricity, fuels, and feedstocks they supply. Setting the standard at the product level simplifies regulation by avoiding the need to monitor thousands of individual aviation customers, fuel distributors, and flights – each with unique operations profiles and compliance pathways.
This approach also embeds the cost of reducing emissions in the product’s price. The regulated application of carbon-intensity standards would require all entities selling technologies and products to comply with the standard, unlocking innovation, competition, and capital. Over time, as demand for these lower-carbon-intensity products grows, governments can step back from any market incentives that might be in place and let industry handle compliance costs.
Direct carbon emissions accounting goes hand-in-hand with carbon-intensity standards to bring all the market forces to bear in reducing emissions. Importantly, feasible standards enable emission reductions in existing products and systems, thus spreading the cost across a very large, established base. This means society can maintain affordability and achieve higher levels of emission reduction. If carbon intensity standards are set by governments, it eliminates today’s carbon leakage (i.e., transferring emissions to less responsible operators) and the economic value leakage that goes along with it since suppliers can’t sell into the market without meeting the standard.
A transition to a lower-emission future must begin at the product level – products are what people demand to meet their needs, and they’re what producers supply from their businesses. Effective policies engage industry participants and competitive markets to drive the best methods to achieve emission reductions at the lowest cost.
5 key features of effective product-level carbon-intensity standards
- Technology neutral: Allow producers to choose any emission-reducing technology to meet standards, ensuring fair competition without bias, and achieving lowest-cost mitigation.
- Recognize over-performance: Encourage innovation by rewarding producers who achieve emissions intensities below the standard, allowing them to trade on the value of the excess reductions within their sector.
- Product and sector specific: Develop carbon-intensity standards for specific products (e.g., fuels, power, steel, cement) while considering regional factors and resources.
- Gradual tightening: Set a baseline for carbon intensity and gradually adjust it over time based on regional, sectoral, technological, affordability, feasibility, and demand factors.
- Ease of implementation: Design targets that involve those participants in the value chain that cover the majority of emissions (e.g., paper products vs. book printers or cement producers vs. builders).
Successful transitions happen when policy, industry, and technology work together
The right policies can drive innovations and technologies that speed up lower-emission options by fueling competition – ultimately leading to efficient markets for lower-emission products. Our focus is on durable, practical policy solutions that take into account increasing global demand for affordable and reliable energy while enabling scalable development and deployment of lower GHG emission technologies.
Beyond CEA, we actively participate in a number of other climate-related policy engagements around the world. Examples of policies ExxonMobil supports:
- Federal Methane Regulations: ExxonMobil supports transparent, actionable policies to reduce methane emissions from the oil and gas industry. Like the IMO’s strategy to remove sulfur from marine diesel fuels, the approach has been technology neutral and governed by predictable product-level standards.
- Greenhouse Gas Reporting Program (GHGRP): ExxonMobil supports the ability of the U.S. Environmental Protection Agency’s GHGRP to provide a single data source for companies to use in their planning and regulators to consider in their policy decisions. In November 2025, ExxonMobil provided a comment letter to the EPA describing these benefits in greater detail.
Policy works best when it works in tandem with the advancements in technology and the industries that can innovate, so progress toward one objective doesn’t undermine another.
Policy improvements can help catalyze cost-effective actions to lower emissions by enabling:
- Different technologies to compete.
- Market-based trading.
- Consumer choice.
- Clear, durable market signals for investment.
- Consistent application at the country level.
Why does policy need to be technology neutral?
When governments focus on the “what” rather than the “how,” they avoid picking winners and losers so that companies can develop and deploy a full range of strategies and technologies for lower emission-intensity products and solutions.
Take the example of low-carbon hydrogen.
Intuitively, you might think hydrogen produced using renewable sources like wind and solar would have zero GHG emissions. But as the chart below shows, that’s not the case.
To compare alternatives, you have to account for the total GHG emissions of each option. For example, the mining, manufacturing, and transportation needed to build wind turbines, solar panels, and renewable power plants all result in direct GHG emissions and should be included in the accounting process.
Natural gas can be used to produce hydrogen using existing infrastructure in a way that wind and nuclear cannot. Hydrogen produced from natural gas with CCS is a cost-effective, scalable, and rapidly deployable alternative to other low-carbon intensity options should regulations or market demand develop. Technology can be used to reduce direct emissions from extraction, processing, and transport of the natural gas, and CCS can further reduce emissions when it is used to produce hydrogen.
Considering these advantages, it’s clear that there are a variety of ways to meet the world’s ambitions – at different costs.
In fact, under MIT’s Net Zero by 2050 scenario, achieving net zero would cost approximately 30% more without low-carbon hydrogen.19 To move that fast, at that scale, all technologies must be on the table.
U.S. hydrogen production on a carbon emissions accounting basis20
*Exxonmobil analysis using CCS and natural gas with reduced direct emissions intensity
**Well-to-gate
Making the “and” equation work
Meeting society’s needs requires more affordable energy and fewer emissions – at the same time. To do both, the world needs rational, constructive policy that:
- Enables technology-neutral competition on cost of abatement.
- Delivers stability and predictability for long-lived investments.
- Implements ledger-based carbon emissions accounting, enabling product-level carbon-intensity standards to activate markets and align incentives.
This approach embraces the realities of industrial systems, rewards innovation, and builds the durable foundations needed to meet society’s energy needs while accelerating emissions reductions – today and in the decades ahead.
Publications
Explore more

Governance and risk management
Report
•
8 min read
• May 5, 2026
Research and development
Report
•
6 min read
• May 5, 2026
Positioned for growth in a lower-emission future
Report
•
8 min read
• May 5, 2026
Driving reductions in methane emissions
Report
•
6 min read
• May 5, 2026
Growing Low Carbon Solutions
Report
•
8 min read
• May 5, 2026FOOTNOTES:
- 2025 ExxonMobil Global Outlook (Aug. 28, 2025)
- IEA (2024), Tracking SDG 7: The Energy Progress Report 2024, https://iea.blob.core.windows.net/assets/cdd62b11-664f-4a85-9eb6-7f577d317311/SDG7-Report2024-0611-V9-highresforweb.pdf
- IEA (2025), Tracking SDG 7: The Energy Progress Report 2025, https://iea.blob.core.windows.net/assets/fc78dc81-8167-4c41-b8a6e3386fecf957/TrackingSDG7TheEnergyProgressReport%2C2025.pdf
- IEA (2025), Global Energy Review 2025, IEA, Paris https://www.iea.org/reports/global-energy-review-2025, Licence: CC BY 4.0; Global CO2 emissions from energy combustion and industrial processes (2014-2024)
- IEA (2025), CO2 emissions per capita were 4.3 tCO2 in 2016 and 2023, the most recent year of reported data. Greenhouse Gas Emissions from Energy Data Explorer, https://www.iea.org/data-and-statistics/data-tools/greenhouse-gas-emissions-from-energy-data-explorer
- World Resources Institute, Nationally Determined Contributions (NDC) Tracker | 2025 NDCs | NDCs 3.0 | Climate Watch
- IEA World Energy Mix, Energy use (2000-2023): https://www.iea.org/world/energy-mix#where-does-the-world-get-its-energy
- 2025 ExxonMobil Global Outlook (Aug. 28, 2025)
- Ibid.
- Ibid.
- ExxonMobil analysis of our 2025 Global Outlook and 2005 Outlook for Energy.
- 2025 ExxonMobil Global Outlook (Aug. 28, 2025)
- Based on ExxonMobil analysis for power plant use including EIA U.S. electricity net generation and resulting CO2 emissions: https://www.eia.gov/tools/faqs/faq.php?id=74&t=11. Reductions may vary based on regional differences and other variables.
- Carbon emissions accounting is based in science and engineering, borrowing concepts from financial reporting, but it is not GAAP. It is an environmental measurement framework that tracks and reports quantities of CO2 emissions at the entity and product level using verifiable lifecycle analysis and carbon intensity calculations which may rely on estimates.
- Adapted from EFI Foundation “Integrated Product- and Entity-Level Carbon Accounting: Putting Concepts into Practice” (October 2025)
- ASTM standards, by category: https://store.astm.org/products-services/standards-and-publications/standards/standards-category-list.html
- International Maritime Organization, Jan. 28, 2021: https://www.imo.org/en/MediaCentre/PressBriefings/pages/02-IMO-2020.aspx
- ExxonMobil analysis based on IEA, World Resource Institute (Climate watch historical GHG emissions data, GREET, China Products Carbon Footprint Factors Database, Eurostat, IHS, EIA, EPA, Ecoinvent)
- The modeling for this study estimates that reaching net zero would cost about 3% GDP. However, if LCI hydrogen is not deployed, the cost of achieving net zero could increase the cost by 0.5-1% of GDP. Assuming a GDP of $38 trillion in 2050, a 3% cost to society equates to $1.1 trillion. The impact of not deploying LCI hydrogen to achieve emission targets changes by year, ranging $160 – 260 billion between 2035 and 2050: https://harnessinghydrogen.npc.org/
- Includes the embodied emissions with power generation.
FORWARD-LOOKING STATEMENT WARNING
CAUTIONARY STATEMENT RELEVANT TO FORWARD LOOKING INFORMATION FOR THE PURPOSE OF THE “SAFE HARBOR” PROVISIONS OF THE PRIVATE SECURITIES LITIGATION REFORM ACT OF 1995 AND OTHER IMPORTANT LEGAL DISCLAIMERS
Images or statements of future ambitions, aims, aspirations, plans, goals, events, projects, projections, opportunities, expectations, performance, potential addressable markets or conditions in the publications, including plans to reduce, abate, avoid or enable avoidance of emissions or reduce emissions intensity, sensitivity analyses, estimates, the development of future technologies, business plans, and sustainability efforts are dependent on future market factors, such as customer demand, continued technological progress, stable policy support and timely rule-making or continuation of government incentives and funding, and represent forward-looking statements. Similarly, emission-reduction roadmaps to drive toward net zero and similar roadmaps for emerging technologies and markets, and water management roadmaps to reduce freshwater intake and/or manage disposal, are forward-looking statements. These statements are not guarantees of future corporate, market or industry performance or outcomes for ExxonMobil or society and are subject to numerous risks and uncertainties, many of which are beyond our control or are even unknown.
Actual future results, including the achievement of ambitions to reach Scope 1 and 2 net zero from operated assets by 2050, to reach Scope 1 and 2 net zero in integrated Upstream Permian Basin unconventional operated assets by 2035, to eliminate routine flaring in-line with World Bank Zero Routine Flaring, to reach near zero methane emissions from operated assets and other methane initiatives to meet ExxonMobil’s greenhouse gas emission reduction plans and goals, divestment and start-up plans, and associated project plans as well as technology advances, including in the timing and outcome of projects to capture, transport and store CO2, produce hydrogen and ammonia, produce lower-emission fuels, produce ProxximaTM systems, produce carbon materials, produce lithium, and use plastic waste as feedstock for advanced recycling; future debt levels and credit ratings; business and project plans, timing, costs, capacities and profitability; resource recoveries and production rates; planned Denbury and Pioneer integrated benefits; detection, measurement and quantification of emissions including obtaining or reporting of that data or updates to previous estimates and progress in sustainability focus areas could vary depending on a number of factors. These include, global or regional changes or imbalances in the supply and demand for oil, gas, petrochemicals, and feedstocks and other market factors; economic conditions and seasonal fluctuations that impact prices, differentials, and volume/mix for our products; new market products and services; future cash flows; our ability to execute operational objectives on a timely and successful basis; the ability to realize efficiencies within and across our business lines; developments or changes in local, national, or international treaties, laws, regulations, taxes, trade sanctions, trade tariffs, or policies affecting our business, such as government policies supporting lower-carbon and new market investment opportunities, or policies limiting the attractiveness of investments such the punitive European taxes on the oil and gas sector and unequal support for different technological methods of emissions reduction or evolving, ambiguous, and unharmonized voluntary and mandatory standards and extraterritorial laws and regulations imposed by various jurisdictions related to sustainability and greenhouse gas reporting and evolving measurement standards for these topics; timely granting of governmental permits, licenses, and certifications; uncertain impacts of deregulation on the legal and regulatory environment; trade patterns and the development and enforcement of local, national and regional mandates; unforeseen technical or operational difficulties; the outcome of research efforts and future technology developments, including the ability to scale projects and technologies such as electrification of operations, advanced recycling, carbon capture and storage, hydrogen and ammonia production, ProxximaTM systems, carbon materials or direct lithium extraction on a commercially competitive basis; the development and competitiveness of alternative energy and emission reduction technologies; unforeseen technical or operating difficulties, including the need for unplanned maintenance; availability of feedstocks for lower-emission fuels, hydrogen, or advanced recycling; changes in the relative energy mix across activities and geographies; the actions of co-venturers or competitors; changes in regional and global economic growth rates and consumer preferences including willingness and ability to pay for reduced emissions products; actions taken by governments and consumers resulting from a pandemic; changes in population growth, economic development or migration patterns; timely completion of construction projects; war, civil unrest, attacks against the Company or industry, and other political or security disturbances, including disruption of land or sea transportation routes; decoupling of economies, realignment of global trade and supply chain networks, and disruptions in military alliances; and other factors discussed here and in Item 1A. Risk Factors of our Annual Report on Form 10-K and under the heading “Factors affecting future results” available under the “Earnings” tab through the “Investors” page of our website at www.exxonmobil.com. The Advancing Climate Solutions Report includes 2025 greenhouse gas emissions performance data as of March 13, 2026, and Scope 3 Category 11 estimates for full year 2025 as of March 13, 2026. The greenhouse gas intensity and greenhouse gas emission estimates include Scope 2 market-based emissions. The Sustainability Report, the Advancing Climate Solutions Report, and combined Executive Summary were issued on May 5, 2026. The content and data referenced in these publications focus primarily on our operations from Jan. 1, 2025 – Dec. 31, 2025, unless otherwise indicated. Tables on our “Metrics and data” page were updated to reflect full year 2025 data. Information regarding some known events or activities in 2026 and historical initiatives from prior years are also included. No party should place undue reliance on these forward-looking statements, which speak only as of the dates of these publications. All forward-looking statements are based on management’s knowledge and reasonable expectations at the time of publication. ExxonMobil assumes no duty to update these statements or materials as of any future date, and neither future distribution of this material nor the continued availability of this material in archive form on our website should be deemed to constitute an update or re-affirmation of these figures or statements as of any future date. Any future update will be provided only through a public disclosure indicating that fact.
See “ABOUT THE ADVANCING CLIMATE SOLUTIONS AND SUSTAINABILITY REPORTS” at the end of this document for additional information on these reports and the use of non-GAAP and other financial measures.
ABOUT THE ADVANCING CLIMATE SOLUTIONS AND SUSTAINABILITY REPORTS
The Advancing Climate Solutions Report contains terms used by the third-party disclosure frameworks. In doing so, ExxonMobil is not obligating itself to use any terms in the way defined or interpreted by any third-party, nor is it obligating itself to comply with any specific recommendation of such parties or to provide any specific disclosure. For example, with respect to the term “material,” individual companies are best suited to determine what information is material, under the long-standing U.S. Supreme Court definition, and whether to include this information in U.S. Securities and Exchange Act filings. The Sustainability Report and Advancing Climate Solutions Report are each a voluntary disclosure and are not designed to fulfill any U.S., foreign, or third-party required reporting framework.
Forward-looking and other statements regarding environmental and other sustainability efforts and aspirations are not intended to communicate any material investment information under the laws of the United States or elsewhere or represent that these are required disclosures in any other context or jurisdiction. These publications are not intended to imply that ExxonMobil has access to any significant non-public insights on future events that the reader could not independently research. In addition, historical, current, and forward-looking environmental, climate-related, and other sustainability-related statements may be based on standards for measuring progress that are still developing, internal controls and processes that continue to evolve, and assumptions that are subject to change in the future, including future laws and rulemaking. Forward-looking and other statements regarding environmental and other sustainability efforts and aspirations are for informational purposes only and are not intended as an advertisement for ExxonMobil’s equity, debt, businesses, products, or services and the reader is specifically notified that any investor-requested disclosure or future required disclosure is not and should not be construed as an inducement for the reader to purchase any product, services, or security. The statements and analysis in these publications represent a good faith effort by the Company to address these investor requests despite significant unknown variables and at times inconsistent market data, government policy signals, and calculation methodologies and reporting standards.
Actions needed to advance ExxonMobil’s 2030 greenhouse gas emission-reductions plans are incorporated into its medium-term business plans, which are updated annually. The reference case for planning beyond 2030 is based on the Company’s Global Outlook research and publication. The Global Outlook is reflective of the existing global policy environment and an assumption of increasing policy stringency and technology improvement to 2050. However, the Global Outlook does not attempt to project the degree of required future policy and technology advancement and deployment for the world, or ExxonMobil, to meet net zero by 2050. As future policies and technology advancements emerge, they will be incorporated into the GIobal Outlook, and the Company’s business plans will be updated as appropriate. References to projects or opportunities may not reflect investment decisions made by the corporation or its affiliates. Individual projects or opportunities may advance based on a number of factors, including availability of stable and supportive policy, permitting, technological advancement for cost-effective abatement, insights from the company planning process, and alignment with our partners and other stakeholders. Capital investment guidance in lower-emission and other new investments is based on our corporate plan; however, actual investment levels will be subject to the availability and attractiveness of investment opportunities, market conditions, stable public policy support, other factors, and focused on returns.
Energy demand modeling is forward-looking by nature aims to replicate integrated dynamics of the global energy system but necessarily involves simplifications to simulate its complexity. The reference to any modeled scenario or any pathway for an energy transition or expansion, including any potential net-zero scenario, does not imply ExxonMobil views any particular scenario as likely to occur. In addition, energy demand scenarios require assumptions on a variety of parameters. As such, the outcome of any given scenario using an energy demand model comes with a high degree of uncertainty. Third-party scenarios discussed in these reports reflect the modeling assumptions and outputs of their respective authors, not ExxonMobil, and their use or inclusion herein is not an endorsement by ExxonMobil of their underlying assumptions, likelihood, or probability. Investment decisions are made on the basis of ExxonMobil’s separate planning process but may be secondarily tested for robustness or resiliency against different assumptions, including against various scenarios. These reports contain information from third parties. ExxonMobil makes no representation or warranty as to the third-party information. Where necessary, ExxonMobil received permission to cite third-party sources, but the information and data remain under the control and direction of the third parties. ExxonMobil has also provided links in this report to third-party websites for ease of reference. ExxonMobil’s use of the third-party content is not an endorsement or adoption of such information.
ExxonMobil reported emissions, including reductions and avoidance performance data, are based on a combination of measured and estimated data. We assess our performance to support continuous improvement throughout the organization using our Environmental Performance Indicator (EPI) manual. The reporting guidelines and indicators in the Ipieca, the American Petroleum Institute (API), the International Association of Oil and Gas Producers Sustainability Reporting Guidance for the Oil and Gas Industry (5th edition, 2025) and key chapters of the GHG Protocol inform the EPI and the selection of the data reported. Emissions reported are estimates only, and performance data depends on variations in processes and operations, the availability of sufficient data, the quality of those data and methodology used for measurement and estimation. Emissions data is subject to change as methods, data quality, and technology improvements occur, and changes to performance data may be updated. Emissions, reductions, abatements and enabled avoidance estimates for non-ExxonMobil operated facilities are included in the equity data and similarly may be updated as changes in the performance data are reported. ExxonMobil’s plans to reduce emissions are good-faith efforts based on current relevant data and methodology, which could be changed or refined. ExxonMobil works to continuously improve its approach to estimate, detect, measure, and address emissions. ExxonMobil actively engages with industry, including API and Ipieca, to improve emission factors and methodologies, including measurements and estimates.
Any reference to ExxonMobil’s support of, work with, or collaboration with a third-party organization within these publications do not constitute or imply an endorsement by ExxonMobil of any or all of the positions or activities of such organization. ExxonMobil participates, along with other companies, institutes, universities and other organizations, in various initiatives, campaigns, projects, groups, trade organizations, and other collaborations among industry and through organizations like the United Nations that express various ambitions, aspirations and goals related to climate change, emissions, sustainability, and an energy transition or expansion. ExxonMobil’s participation or membership in such collaborations is not a promise or guarantee that ExxonMobil’s individual ambitions, future performance or policies will align with the collective ambitions of the organizations or the individual ambitions of other participants, all of which are subject to a variety of uncertainties and other factors, many of which may be beyond ExxonMobil’s control, including government regulation, availability and cost-effectiveness of technologies, and market forces, geopolitical, realignment, conflicts and other risks and uncertainties. Such third parties’ statements of collaborative or individual ambitions and goals frequently diverge from ExxonMobil’s own ambitions, plans, goals, commitments and investments. ExxonMobil will continue to make independent decisions regarding the operation of its business, including its climate-related and sustainability-related ambitions, plans, goals, commitments, and investments. ExxonMobil’s future ambitions, plans, goals commitments, and investments reflect ExxonMobil’s current plans, and ExxonMobil may unilaterally change them for various reasons, including adoption of new reporting standards or practices, market conditions; changes in its portfolio; and financial, operational, regulatory, reputational, legal and other factors.
References to “resources,” “resource base,” and similar terms refer to the total remaining estimated quantities of oil and natural gas that are expected to be ultimately recoverable. The resource base includes quantities of oil and natural gas classified as proved reserves, as well as quantities that are not yet classified as proved reserves, but that are expected to be ultimately recoverable. The term “resource base” is not intended to correspond to SEC definitions such as “probable” or “possible” reserves. For additional information, see the “Frequently Used Terms” on the Investors page of the Company’s website at www.exxonmobil.com under the header “Modeling Toolkit.” References to “oil” and “gas” include crude, natural gas liquids, bitumen, synthetic oil, and natural gas. The term “project” as used in these publications can refer to a variety of different activities and does not necessarily have the same meaning as in any government payment transparency reports.
Exxon Mobil Corporation has numerous affiliates, many with names that include ExxonMobil, Exxon, Mobil, Esso, and XTO. For convenience and simplicity, those terms and terms such as “Corporation,” “company,” “our,” “we,” and “its” are sometimes used as abbreviated references to one or more specific affiliates or affiliate groups. Abbreviated references describing global or regional operational organizations, and global or regional business lines are also sometimes used for convenience and simplicity. Nothing contained herein is intended to override the corporate separateness of affiliated companies. Exxon Mobil Corporation’s goals do not guarantee any action or future performance by its affiliates or Exxon Mobil Corporation’s responsibility for those affiliates’ actions and future performance, each affiliate of which manages its own affairs. For convenience and simplicity, words like venture, joint venture, partnership, co-venturer and partner are used to indicate business relationships involving common activities and interests, and those words may not indicate precise legal relationships. These publications cover Exxon Mobil Corporation’s owned and operated businesses and do not address the performance or operations of our suppliers, contractors or partners unless otherwise noted. In the case of certain joint ventures for which ExxonMobil is the operator, we often exercise influence but not control. Thus, the governance, processes, management and strategy of these joint ventures may differ from those in these reports. ExxonMobil completed the acquisitions of Denbury Inc. and Pioneer Natural Resources Company in 2023 and 2024, respectively. These reports and the data therein do not speak of these companies’ pre-acquisition governance, risk management, strategy approaches, or emissions or sustainability performance unless specifically referenced.
These reports or any material therein are not to be used or reproduced without the permission of Exxon Mobil Corporation. All rights reserved
SUPPLEMENTAL INFORMATION FOR NON-GAAP AND OTHER MEASURES
The Positioned for Growth in a Lower-Emission Future section of the Advancing Climate Solutions Report mentions our assessment of the strength our business and investment portfolio against a range of future outcomes, including third-party scenarios. The Company believes this can be helpful in assessing the resiliency of the business to generate cash from different potential future markets. The performance data presented in the Advancing Climate Solutions Report and Sustainability Report, including on emissions, is not financial data and is not GAAP data.