Report
8 min read
• May 5, 2026Positioned for growth in a lower-emission future
- Our company-wide transformation has improved our earnings power, driving efficiencies that better leverage the scale of our integrated company.
- Our Upstream and Product Solutions businesses continue to lower emissions intensity while growing production of energy and products people need every day.
- As a technology company that transforms molecules, we’re advancing new technology-driven businesses, with the earnings potential for these opportunities to grow to ~$13 billion by 2040.1
- We’ve built a robust business and investment portfolio that is positioned to grow in an energy transition.
Report
8 min read
• May 5, 2026Navigate to:
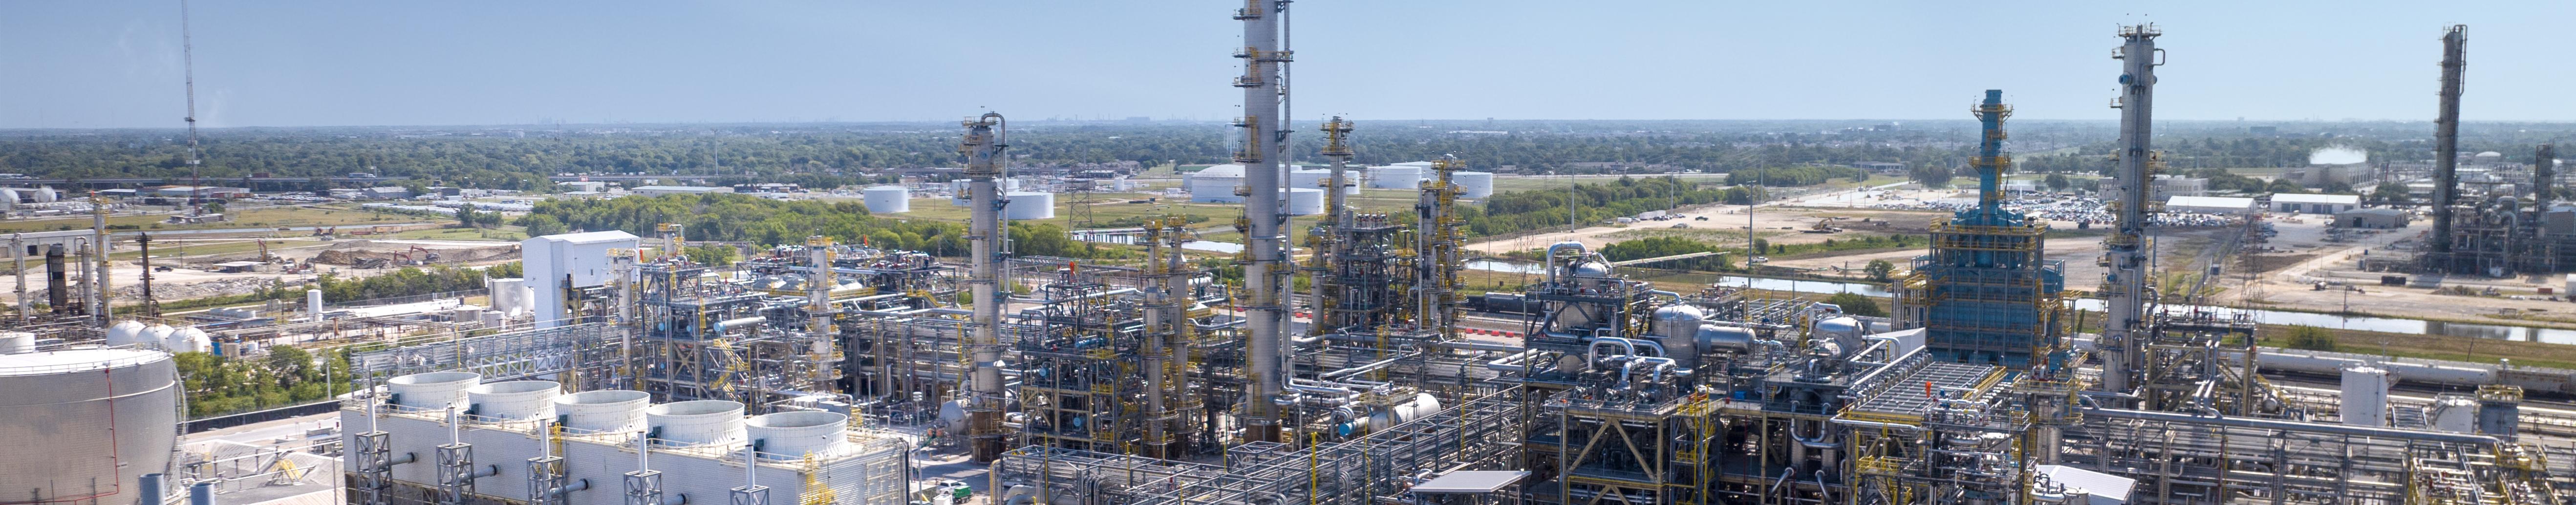
ExxonMobil’s set of competitive advantages puts us in a league of our own. The transformation we began in 2018 continues to tear down organizational silos and unlock the potential of our people and capabilities. We are uniquely positioned to help meet the world’s energy and product needs and reduce emissions – now and well into the future.
Our company-wide transformation has done more than improve our earnings power – it has fundamentally changed how our company works, how we deploy our capital and expertise, and how we leverage our scale. It allows us to put our full set of competitive advantages to work in a way that is difficult, if not impossible, for anyone to replicate.
-
Our purpose
Create sustainable solutions that improve quality of life and meet society's evolving needs. -
Our vision
Lead industry in innovations that advance modern living and a net-zero future.
Core Businesses
Upstream: Strengthening energy security by expanding low-cost-of-supply oil and gas operations. ExxonMobil is creating long-term value by leveraging our unique competitive advantages.
Product Solutions: One of the largest integrated fuels, chemicals, and lubricants businesses in the world. ExxonMobil leverages integrated capabilities and technologies, processing oil and gas as well as other raw materials to create value-added products and solutions for everyday uses, such as fuels, lubricants, plastics, fertilizers, detergents, paints, and more.
Low Carbon Solutions: Leadership for a lower-carbon future, leveraging ExxonMobil’s unmatched combination of our technical capabilities and scale to accelerate GHG emission reductions for customers and in our own businesses.
Upstream: Meeting energy demand and lowering emissions intensity
We are in a strong position to help meet the world’s demand for oil and natural gas over the next decade and beyond. With our industry-leading operations integrity and execution excellence, we’re focused on growing value by increasing high-value production at a low cost of supply, reducing our emissions intensity, and driving additional structural cost savings.
In our 2025 Corporate Plan Update, we announced that we’re beating our 2030 GHG emission-intensity reduction plans across our portfolio. We’ve achieved our plans for upstream and corporate-wide GHG intensity, as well as corporate-wide flaring intensity, but we’re not stopping there. We expect to achieve our plan for corporate-wide methane intensity by the end of 2026.2
We’ve identified more than 150 potential modifications to reduce GHG emissions across our upstream operated assets, including efficiency measures and equipment upgrades. Some examples include installing carbon capture and storage technologies at operations in the United States, electrifying our Permian operations, and replacing pneumatic devices to reduce fugitive methane emissions.
We expect to deliver top-quartile Scope 1 and 2 emissions intensity in each of our asset classes – Heavy Oil, LNG, and Oil and Flowing Gas - by 2030.3
Unconventional operations
In 2021, we announced industry-leading plans to achieve net-zero Scope 1 and 2 GHG emissions in 2030 for our operated unconventional assets in the Permian Basin. In 2024, we acquired Pioneer Natural Resources – more than doubling our Permian footprint. We are now operating as a single combined entity across the region.
We are on track to achieve net-zero Scope 1 and 2 GHG emissions across all our Permian operations by 2035 – 15 years faster than Pioneer had planned for its assets before the merger. By 2030, we plan to reduce emissions in our combined Permian operations by more than the equivalent of achieving net zero in our heritage ExxonMobil assets.
We eliminated routine flaring in our heritage operated assets in the Permian Basin, in line with the World Bank’s Zero Routine Flaring by 2030 Initiative.4
In 2025, our facilities in Poker Lake, New Mexico, received a top grade from MiQ, an independent validator of methane management, for the fifth time.
Our emission-reduction roadmaps lay out the options for lowering emissions in our operations. These are updated regularly, including the integration of our Pioneer assets in 2025. Abatement options include:
- Continued electrification of our operations.
- Continued process improvements.
- Reducing methane emissions through redesigns and eliminating pneumatic devices.
- Eliminating routine flaring in line with the World Bank's Zero Routine Flaring by 2030 Initiative.
- Use of lower-emission energy in our operations.
For our Permian Basin operations, we have enabled new renewable power generation projects by contracting with power providers for 4 gigawatts of renewable power capacity on the same power grid.
We’re deploying leading-edge technology on the ground, in the air, and in space to mitigate, monitor, and measure methane emissions.
Liquefied natural gas (LNG)
LNG is an important lower-emission option that can replace coal in power generation and heavy industry. By 2050, our Global Outlook projects that natural gas will fuel about 25% of the world’s primary energy demand.5
We’re continuing to develop our low-cost-of-supply LNG portfolio, and we are on track to supply more than 40 million tons per year by 2030 globally. We have projects in the United States, Papua New Guinea, Mozambique, and Qatar.6
Our operated LNG asset class is expected to be among industry’s lowest in GHG intensity by 2030.7
Deepwater
Our Guyana developments are among the lowest emissions-intensity in our portfolio. Our floating production, storage, and offloading vessels (FPSOs) in the region have zero routine flaring – approximately 99% of the gas is used for fuel or reinjected. In 2025, we completed our fourth deepwater development in Guyana, where our “design one, build many” approach enabled us to deliver large-scale projects with industry-leading efficiency. Our Prosperity FPSO and ONE GUYANA FPSO have also earned SUSTAIN-1 notation by the American Bureau of Shipping in recognition of their design, documentation, and operational procedures. Liza Unity FPSO was the first FPSO globally to be assigned the enhanced SUSTAIN notation in 2025.
Product Solutions: Innovative products critical to modern society
Our Product Solutions business makes and sells products needed for modern life. And there is increasing demand for high-value products with lower life-cycle GHG emissions. Making these requires innovation in the design of our products and in our manufacturing processes.
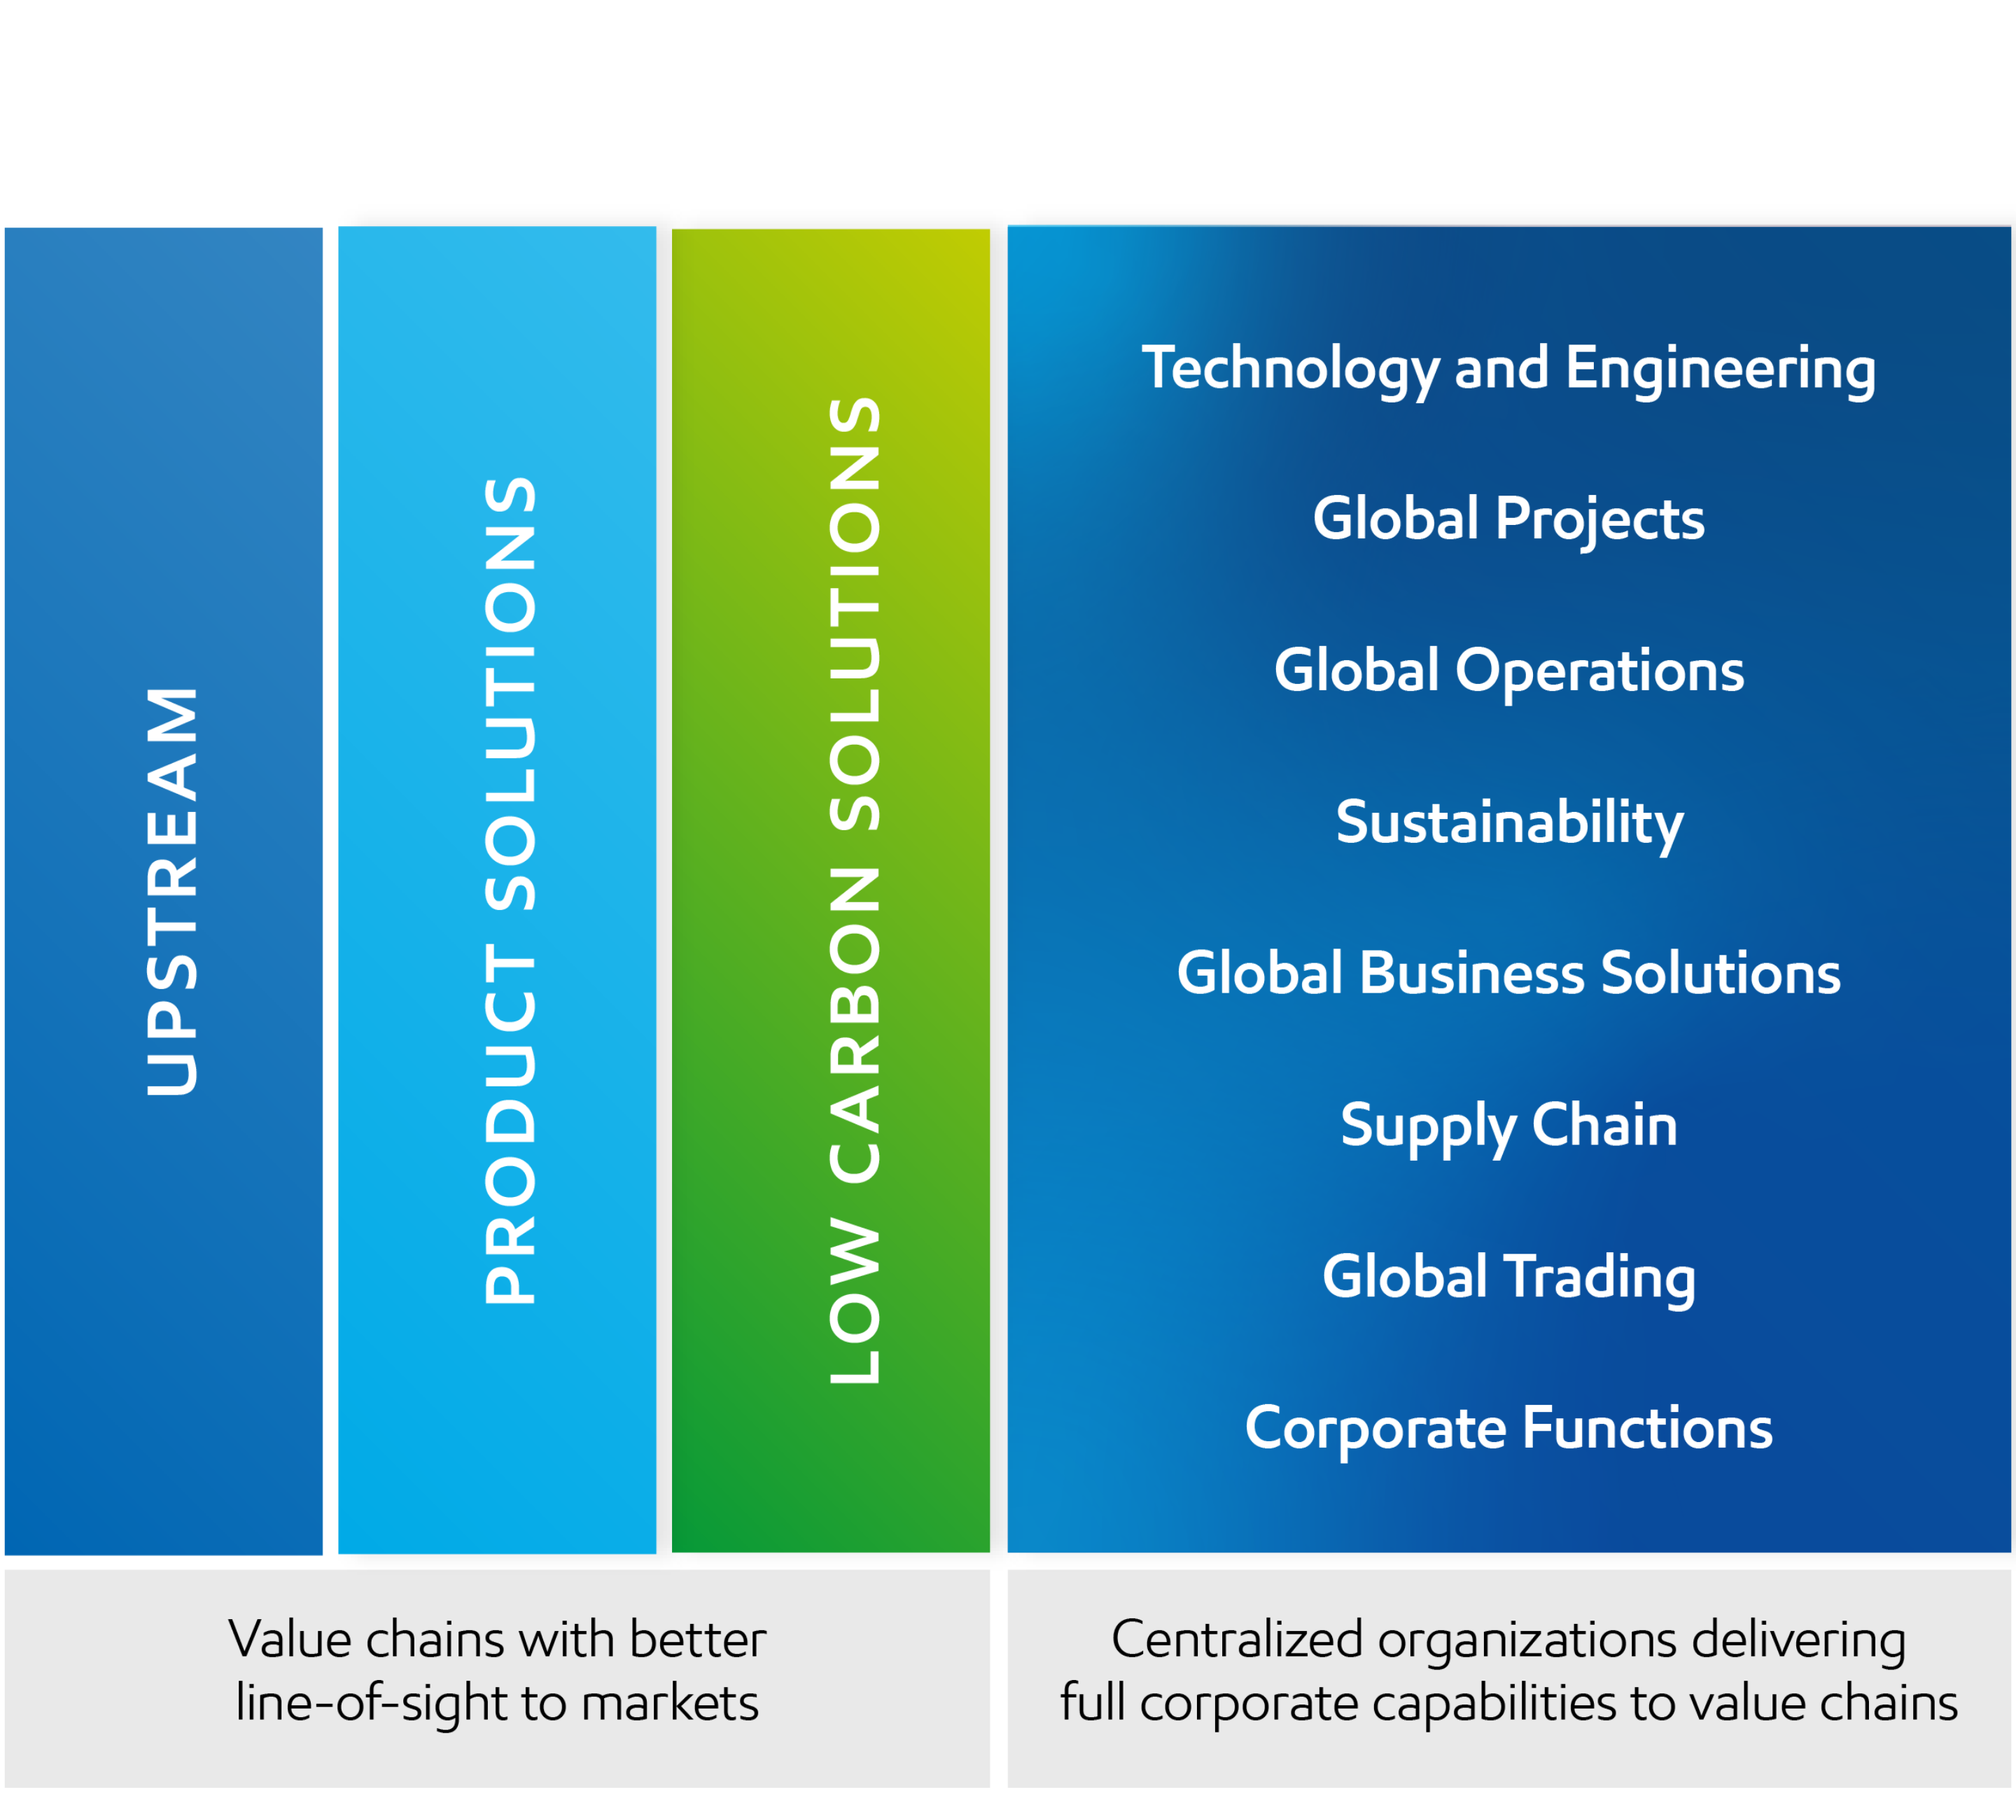
Commercial transport and chemicals drive oil demand while industrial activity and power drive demand for natural gas
Our energy products and chemicals businesses each operate assets that are among the lowest in the industry for GHG intensity.8 Through 2030, we expect our emissions reduction plans to more than offset emissions from new operated facilities needed to meet growing demand. Among other actions, our emission-reduction plans consider:
- Use of lower-emission energy in our operations.
- Energy efficiency projects.
- Reconfiguration of existing facilities.
Energy products
Our Global Outlook shows that demand for energy-dense, lower-emission fuels is expected to grow rapidly.9 This increase will be driven in part by the hard-to-decarbonize commercial transportation sector that includes aviation, marine, and heavy-duty trucking.
Across our portfolio, we have the flexibility to shift production to help meet this demand. Around 70% of our manufacturing capacity is co-located in large, integrated sites that can make this switch. As demand for conventional gasoline and diesel declines, we can repurpose assets to make other high-value products like chemicals, lubricants, and lower-emission fuels.
Chemical products
Cellphones, medical and hygiene supplies, diapers, packaging and storage to preserve food – all of these are needed for modern life. That’s why global chemical demand continues to grow.10
And all of these products rely on materials we manufacture in our Chemicals businesses. At our world-class technology centers our scientists research the latest polymers, plastics, and products to meet the needs of tomorrow.
As population and prosperity keep rising around the world, demand for performance chemicals is expected to be strong. This includes the performance polyethylene and polypropylene in our ExxonMobil Signature Polymers portfolio.
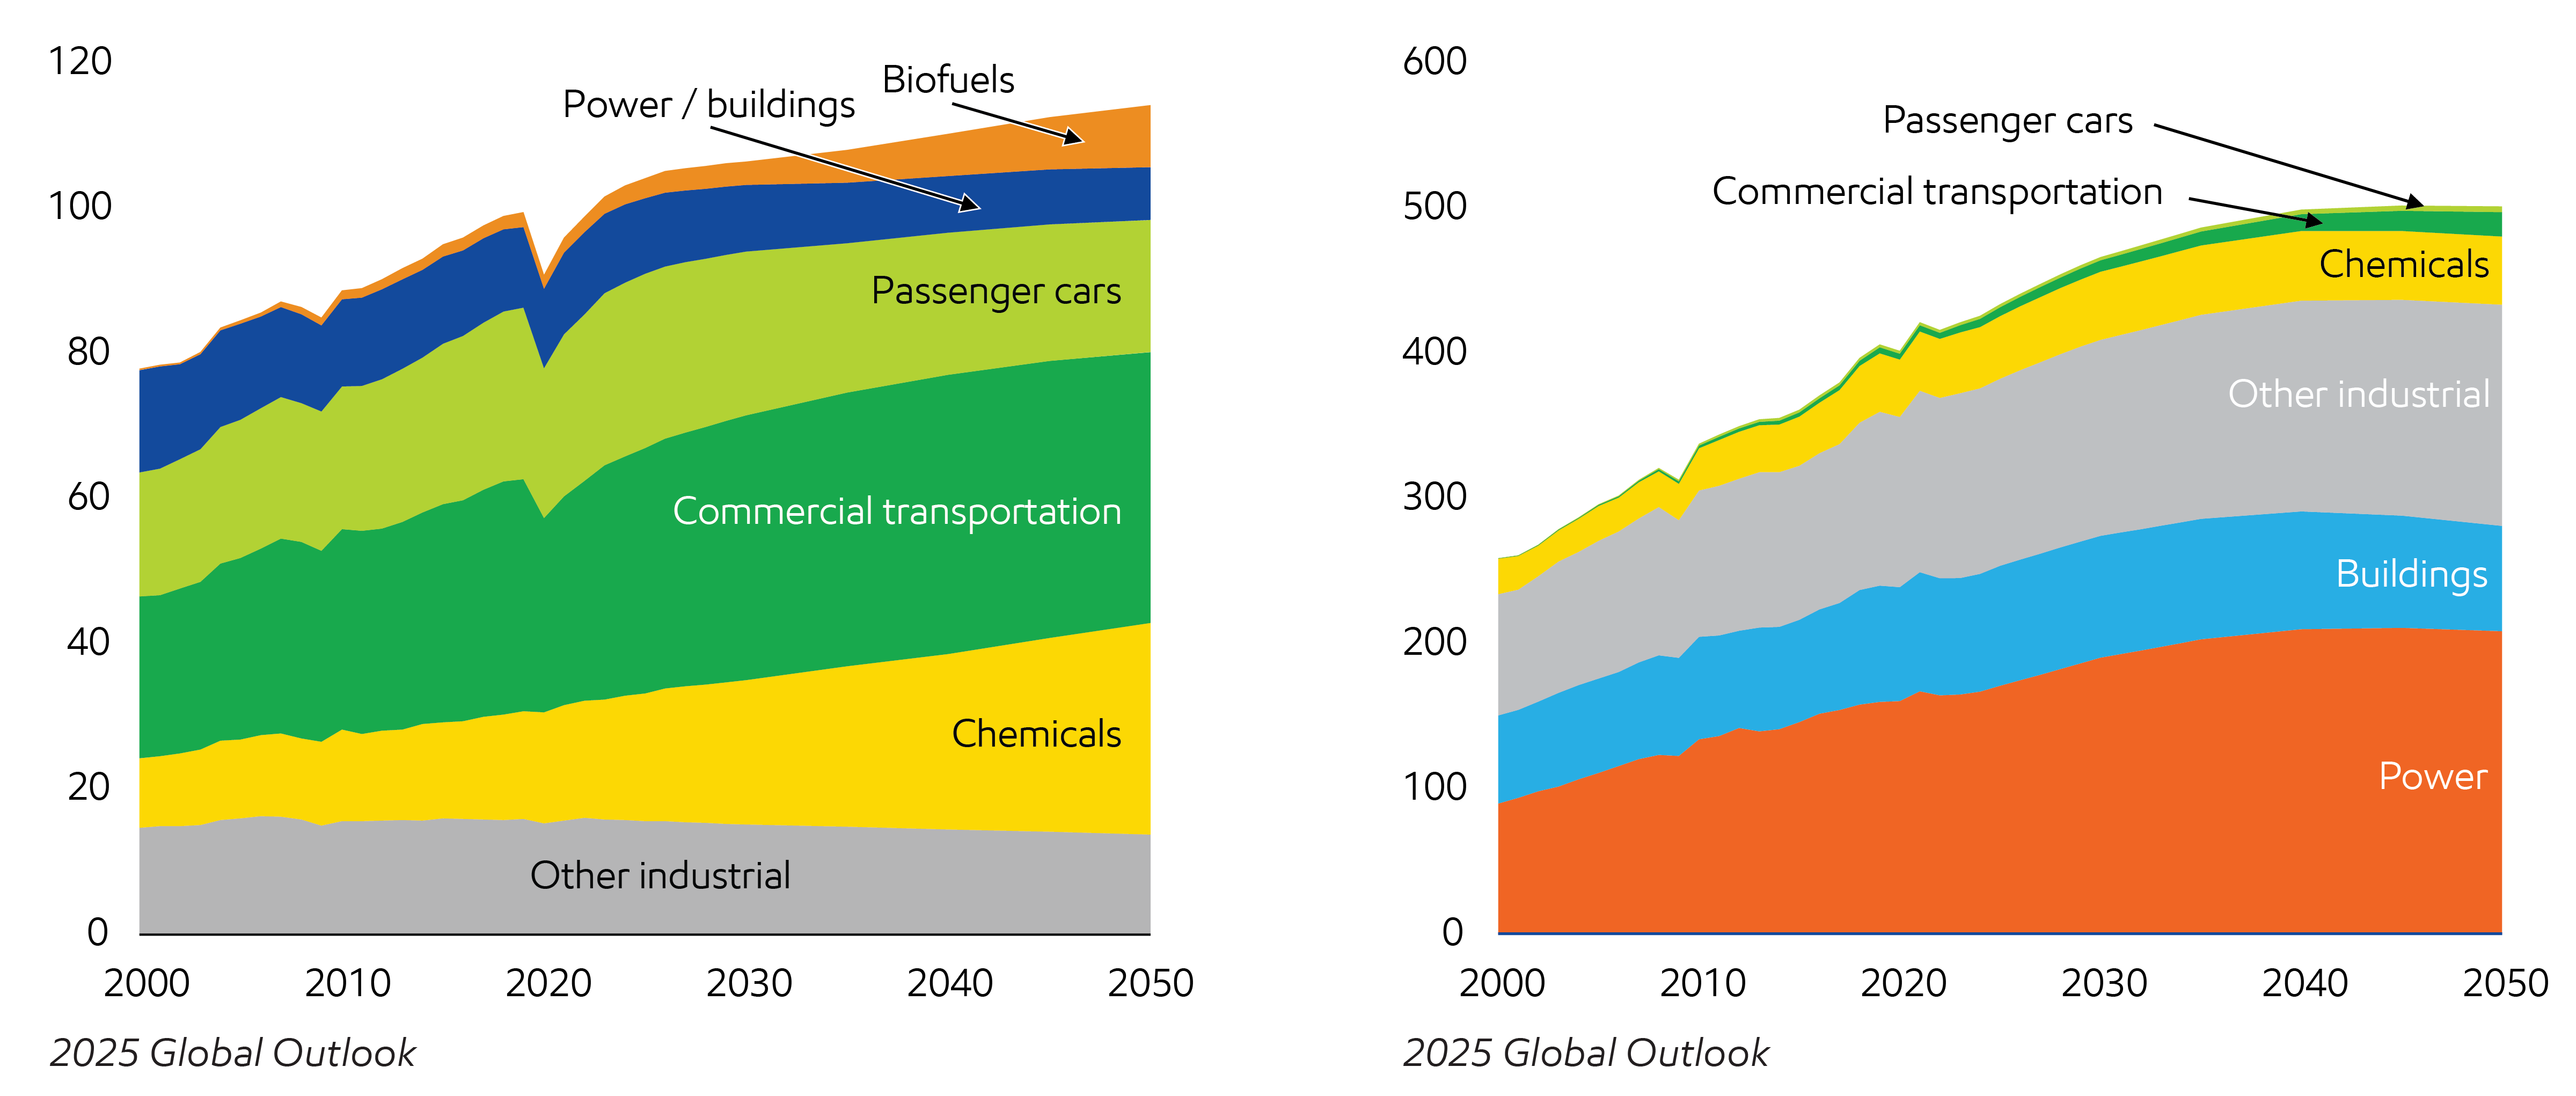
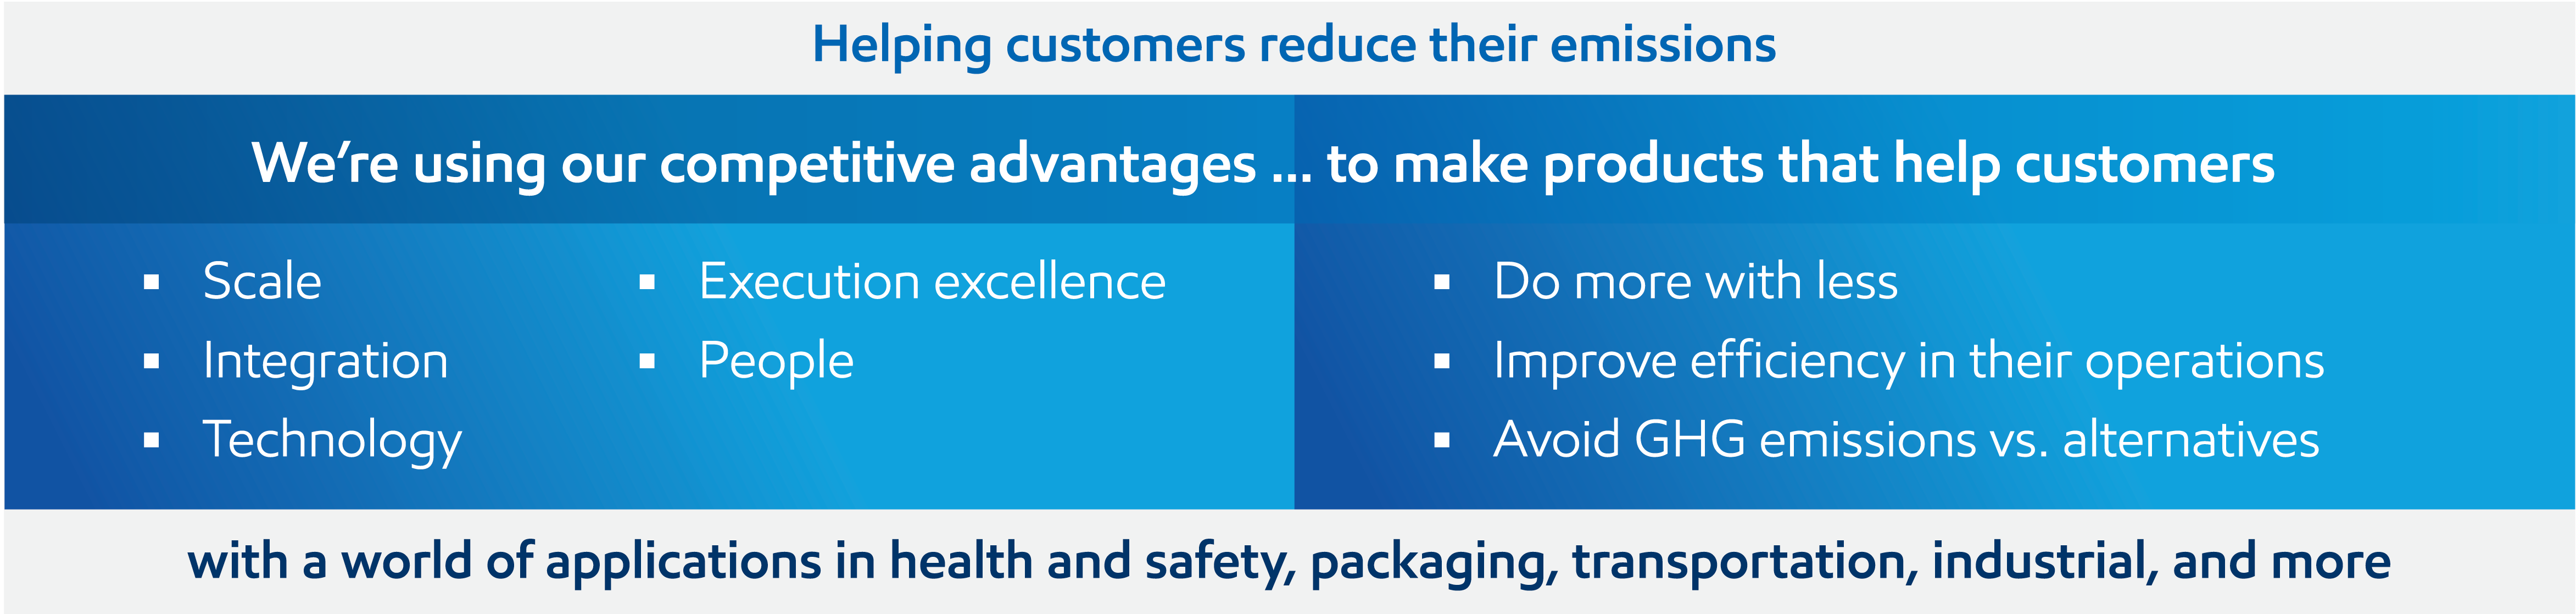
Our customers use these materials in products that improve quality of life – in ways that can also support their efficiency and emissions objectives. Many of the products in our Chemicals portfolio are used to advance sustainability benefits in products, such as:
- Agricultural films that increase crop yields.
- Packaging films that extend shelf life and decrease food waste.
- Protective adhesive layers used in solar panels.
- Solvents used in battery recycling.
- Coatings used to make faux leather feel more real.
We continue to grow the supply of performance chemicals through large, competitively advantaged investments such as:
- Our China Chemical Complex, a world-scale, wholly owned facility started up in 2025, bringing additional high-value performance chemicals to China’s growing domestic market. It includes a world‑class steam cracker with the capacity to produce up to 1.6 million tons of ethylene per year. It also features two high‑performance linear low‑density polyethylene units with a combined capacity of 1.2 million tons annually.
- The Gulf Coast Growth Ventures (GCGV) joint venture we operate near Corpus Christi, which has been up and running since 2021, now uses utility-scale solar power.11 GCGV has a 1.8 million-metric-ton-per-year ethane steam cracker, two polyethylene units that can produce up to 1.3 million metric tons per year, and a 1 million metric-ton-per-year monoethylene glycol unit.
- Our Baytown, Texas, complex, which started up its third advanced recycling unit in 2025. Baytown has the capacity to process up to 250 million pounds of plastic waste annually. That means more plastic waste is diverted from landfills and transformed into raw materials for products people use every day.
- Our performance polypropylene project in Baton Rouge, Louisiana, which had its third full year of operations, added production capacity of 450,000 metric tons per year along the U.S. Gulf Coast.
Specialty products
We are rapidly advancing new businesses like ProxximaTM resin systems and carbon materials for advanced synthetic graphite.
We’ve demonstrated the value-in-use for our ProxximaTM thermoset resin – a material rooted in novel chemistry that enables products which can be stronger, lighter, more corrosion-resistant, and have a lower carbon footprint than steel.12 The applications include everything from high-performance coatings and injection molding to applications where metals are commonly used, such as rebar, structural components for automobiles, and new high-strength EV battery cases.
In our Graphite Materials business, we see a massive opportunity in the market for advanced synthetic graphite to power energy storage innovation, with applications in EVs, grid storage, data centers, and much more. In EV battery anodes, our material outperforms traditional graphite materials, offering:
- 30% faster charging.
- Up to 30% higher usable battery capacity.
- Up to 4x longer battery life.
Our aim is to produce world-scale quantities of next-generation synthetic graphite with a process that starts with low-value molecules from our refineries. Our advantaged process is expected to be less energy-intensive, more land-efficient, and have higher throughput than many current industry offers.13
Demand for lubricants is expected to remain strong and grow in the industrial, aviation, and marine sectors. We continue to increase the supply of high-value base stocks through large, competitively advantaged investments. Some examples:
- Our Singapore resid upgrade project started up in 2025, deploying breakthrough proprietary technologies that convert low-value, bottom-of-the-barrel molecules into some of the highest-value lubricant base stocks we offer. The new facilities expand our base stocks production capacity by 20,000 barrels per day, including up to 6,000 barrels per day of the new-to-industry EHC 340 MAXTM – a base stock with applications in commercial vehicles and industrial sectors.
- A lubricant manufacturing plant we're building in India that will have capacity of 159,000 kiloliters of finished lubricants per year. This facility will help meet the growing demand for high-quality automotive and industrial lubricants in the country.
- Our Baytown, Texas, complex announced plans to reshape its capabilities with a major reconfiguration project, increasing production of higher-value products like diesel and base stocks. As gasoline demand declines over time, the need for high-quality base stocks will remain strong. This investment expands our product offering to include high-quality Group III base stocks, key building blocks for lubricants. As a result, ExxonMobil will be the only supplier offering the full range of Group I-V base stocks.
Innovative solutions to improve modern life
- Polyethylene packaging typically has half the GHG emissions of metal, glass, and paper alternatives studied in peer-reviewed life-cycle assessments in the U.S. and Europe.14
- ExceedTM XP performance polyethylene enables up to 30% thinner plastic packaging versus conventional plastics for equivalent performance.15
- ProxximaTM resin systems outperform alternatives in applications like concrete reinforcement, wind turbine blades, subsea pipeline coatings, and vehicle parts while having lower GHG emissions than thermoset resin systems studied.16
Total vehicle product solutions improve transportation efficiency
- Plastics can enable lighter vehicles and 6%-8% fuel efficiency improvement for every 10% reduction in vehicle weight.17
- Halobutyl rubber improves air retention in tires, which can increase electric vehicle range by up to 7%.18
- Mobil 1TM ESP x2 0W-20 engine oil helps provide up to 4% fuel economy improvement.19
- Renewable diesel may reduce carbon emissions by up to 80% compared to conventional diesel.20
- Marine biofuel can reduce carbon emissions by up to 30% compared to conventional marine fuel.21
Reliable solutions for industrial efficiency
- Mobil DTE 10 ExcelTM Series provides up to 6% improvement in hydraulic pump efficiency vs. Mobil standard hydraulic fluids.22
- Mobil SHCTM 600 Series provides up to 3.6% energy efficiency gain vs. conventional mineral oils.23
- Mobil SHCTM Gear WT helps reduce oil consumption and maintenance costs for wind turbines through extended oil life and drain intervals.24
Our robust business through 2050
The world will need more energy in 2050 than it does today, as populations grow and people in developing nations become more prosperous.
In the years ahead, society doesn’t have to choose between higher living standards and lower emissions. We can do both. It is an “and” equation – meeting the growing demand for energy and reducing emissions. Finding solutions that work will take new technology, rational and constructive policy, and competitive markets that drive innovation and pay for emission reductions.
A key part of ExxonMobil’s purpose is meeting society’s evolving needs – it’s what we’ve done for more than 140 years. Our company is positioned to grow across a range of lower-emission pathways, including lower- and higher-demand scenarios.
Adapting to evolving pathways for a lower-emission future
Our steadfast strategy is a blueprint to win, irrespective of the pace and direction of an energy transition. We use the projections in our Global Outlook as the basis for our business planning.
No single transition pathway can be reasonably predicted. There is still a wide range of uncertainties. As a result, we assess the strength of our business and investment portfolio against a range of future outcomes. Even under extreme, unrealistic third-party scenarios, our business is well positioned to generate growth and value. We see great potential for products in our portfolio that are critical to a lower-emission future, including chemicals, carbon capture, solar storage, hydrogen, lower-emission fuels, ProxximaTM resin systems, and carbon materials.
In the past, we have provided the results of our business and investment portfolio modeling based on the International Energy Agency’s Net Zero Emissions by 2050 scenario, a widely known scenario depicting an extreme case of lower oil and gas demand, well below the demand in most 1.5°C IPCC scenarios. This work showed a robust ExxonMobil business through 2050, with flexibility to grow cash flows even under the deeply flawed IEA NZE assumptions. In its 2025 World Energy Outlook, the IEA stated that “exceeding 1.5°C is now inevitable and the world is still not on an NZE pathway.”
As a result, we are not including an updated model of our portfolio under this obsolete scenario. We continue to be resilient and well-positioned to grow across a range of lower-emission pathways, including previous NZE scenarios. It is more meaningful to consider more realistic scenarios.
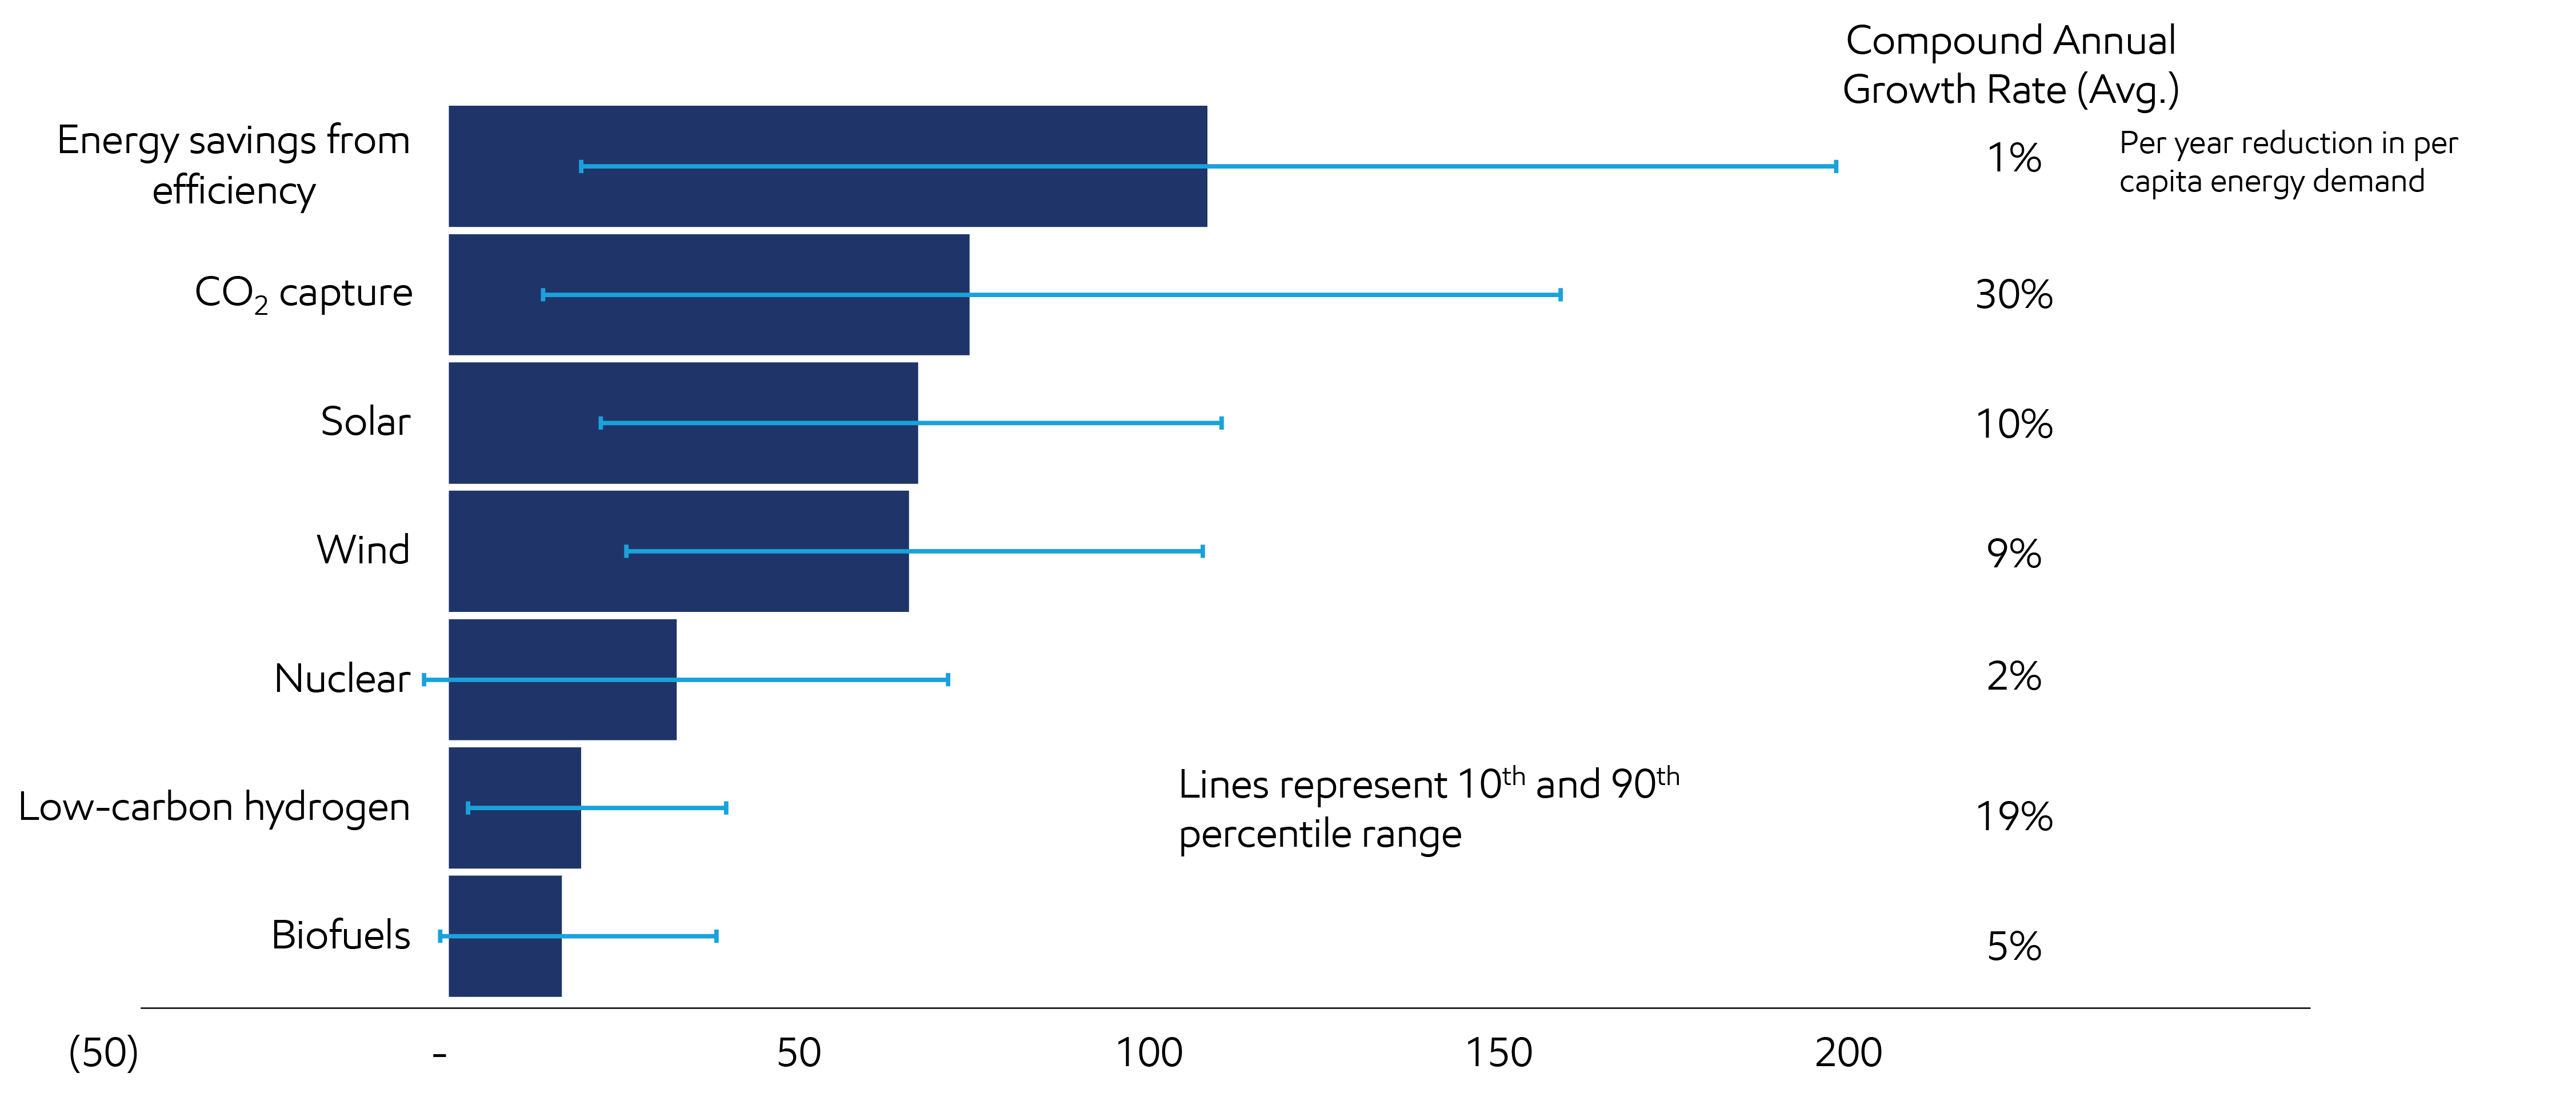
As we have seen, any energy transition will unfold at an uncertain pace, determined in part by variations in policy and affordability by region and advancements in technology. Our Global Outlook provides our view of how these and other signposts affect supply and demand dynamics around the world. Faster transition pathways, such as the likely below 2°C scenarios included in the IPCC AR6 Scenario Database provide a range of alternative views, each with significant growth opportunities in lower-emission solutions.
Solutions deployed in IPCC pathways
Quadrillion Btu growth 2020 to 2050
As an integrated company with assets around the world, we have seen that economic events and trends may have a negative effect on one asset and an offsetting positive effect on others, with a minimal net effect on the full portfolio. Analyzing assets in isolation can overlook or misinterpret the interplay among assets in the market and the optionality of assets in a specific region.
Other companies have different asset portfolios, strategies, markets, and regulatory realities. These lend themselves to different approaches and may lead to different strategies.
Our robust portfolio gives us the ability and flexibility to reallocate capital across our diverse asset base – including oil and natural gas, chemicals, carbon capture and storage, lower‑emission fuels, hydrogen, carbon materials, and lithium – to maximize shareholder value as policy, technology, and markets develop.
In an extreme transition scenario, we could:
Upstream
- Focus on competitive resources: Prioritize assets with shorter production cycles (e.g., the Permian Basin) and lower cost of supply (e.g., Guyana).
- Cease exploration in new basins: Reduce spending on new developments if long-term decline in demand and pricing materializes.
- Optimize long-term production: Focus on cost efficient, lower GHG-emissions-intensity assets to meet global demand.
Product Solutions
- Reconfigure manufacturing: Shift sites to meet demand for non combusted products and lower emission fuels. One current example is our investments in Canada, where our affiliate Imperial Oil recently started up a renewable diesel facility with the capacity to produce up to 20,000 barrels a day of lower-GHG-emission fuels.25
- Support product demand: Invest in value accretive projects (e.g., U.S. Gulf Coast, Singapore, China) and new materials with lower GHG-emissions-intensity (e.g., ProxximaTM resin systems).
- Advance additional integration: Carbon capture and storage and/or fuel switching with hydrogen technology would further accelerate lowering GHG intensity, with less-advantaged sites potentially closed or converted to terminals.
Low Carbon Solutions
- Capitalize on growth potential: Explore significant opportunities where momentum for reducing emissions can translate into commercial value (e.g., carbon capture and storage, carbon materials, lower-emission fuels).
- Leverage core capabilities: Utilize subsurface expertise, large-project execution excellence, project scaling, existing assets, and our skilled workforce to compete effectively.
- Benefit from increased carbon price: Would support attractive returns on investment in Low Carbon Solutions.
- Focus on key projects: Scale projects like lower-emission fuels, hydrogen, geologic storage for CO2, and new industrial clusters to advance infrastructure opportunities and position us as a partner of choice for potential customers.
Use of sensitivity analysis
Sensitivity analysis provides greater perspective on how variations to our Global Outlook assumptions could affect projected energy supply and demand. Analyzing these sensitivities involves evaluating possible technology advancements and their potential impact on energy supply and demand. This results in a range of potential low- to high-demand outcomes for certain energy sources. The projections yielded by sensitivity analysis do not represent our viewpoint or the likelihood of these alternatives but can provide context.
Proved reserves
Each year, we assess our proved reserves and report them in our annual Form 10-K filing, following the rules set by the U.S. Securities and Exchange Commission. According to our 2025 production schedules, a substantial majority of our proved reserves at the end of 2025 are expected to be produced by 2050. The rest are generally linked to assets where most development costs are incurred before 2050. While these reserves might face more stringent climate-related policies in the future, advancements in technology and strategic investments could help reduce GHG emissions and associated costs. These mature assets generally have a lower risk profile due to the experience and technical knowledge gained over decades of production.
Resources
We have a large and diverse portfolio of undeveloped resources. These provide us the flexibility to develop new supplies to meet future demand. We work to enhance the quality of this resource base through:
- Successful exploration.
- Application of new technology.
- Acquisitions.
- Divestments.
- Development planning efforts.
- Appraisal activities.
The underlying economics of commercializing resources depend on factors we assess annually. Options include developing the resource, selling it, or exiting it. All investments are tested over a wide range of commodity price assumptions and market conditions, including extreme lower-demand scenarios.
It is impossible to know which specific assets will ultimately be developed, given the array of dynamic factors that influence governments’ diverse approaches to regulation and industry’s commercial decisions. Diverse, long-lived assets are a hedge against instability. For example:
- Regional policies that constrain supply in one area could enhance returns in others.
- Geopolitical conflict in one region could advantage resources in another.
We’re confident in our ability to apply high-impact technologies to position our portfolio to compete successfully in a broad range of scenarios.
An energy transition is a global opportunity – and it will take significant investment26
There is no credible energy transition scenario that doesn’t include a role for oil and natural gas.
By 2050:
- Our Global Outlook shows an ~25% increase in energy use in developing countries vs. 2024. This will be driven by population growth and rising living standards.
- The IEA Current Policies Scenario (CPS) projects global oil demand to average ~113 million barrels per day in 2050. The Stated Policies Scenario (STEPS) projects 97 million barrels per day. Our Global Outlook projection falls in between – around 105 million barrels per day.
- The Intergovernmental Panel on Climate Change’s Likely Below 2°C scenarios show an average global oil demand of ~65 million barrels per day in 2050.
- The International Energy Association shows ~24 million barrels per day of oil demand in their Net Zero Emissions (IEA NZE) by 2050 scenario, although they acknowledge that the world is not on this path.
The variations in these projections and scenarios come from the different approaches taken. Our Outlook models supply and demand dynamics, scientifically grounded in long-term market fundamentals. But many scenarios start at the end with a target in mind, then work backward to propose pathways to get there. The IEA NZE is an extreme example of this.
Projected global oil supply and demand
Million barrels per day
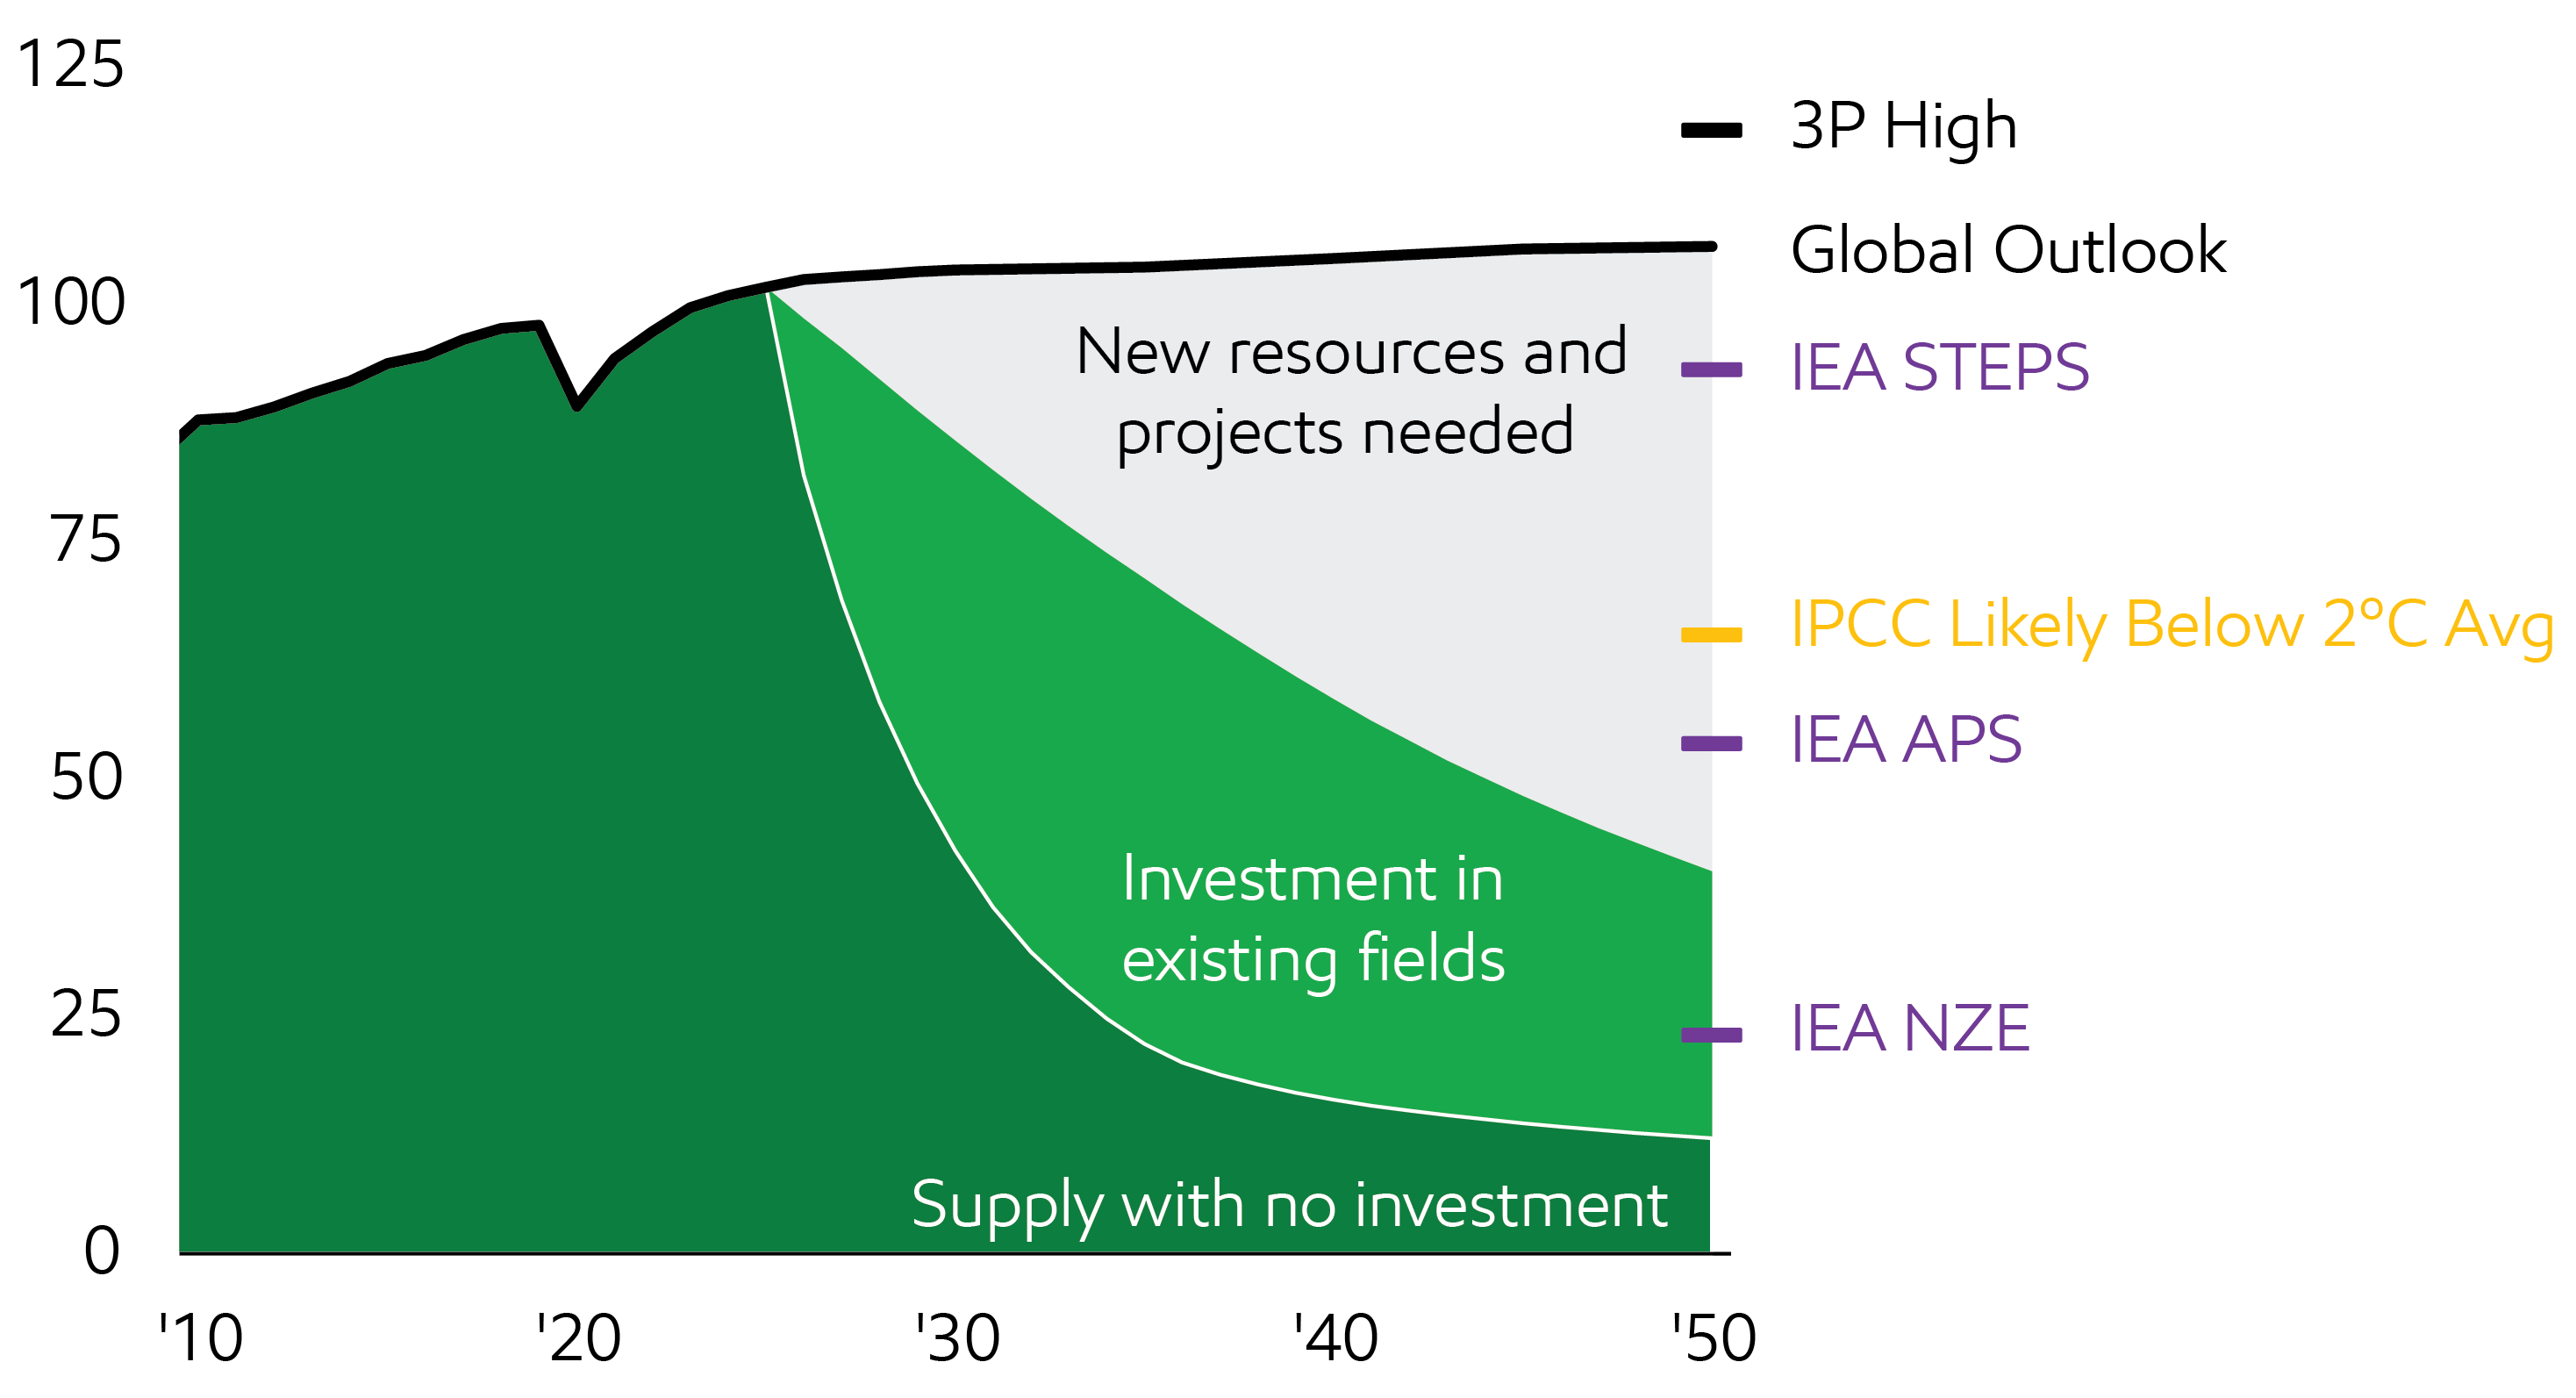
Source: Form 10-K filing
Excludes biofuels; IEA STEPS and IEA NZE Source: IEA WEO 2025; IEA APS Source: IEA WEO 2024; Global Outlook Source: ExxonMobil 2025 Global Outlook; IPCC Likely Below 2°C Average Source: IPCC AR6 Scenarios Database hosted by IIASA release 1.0 average IPCC C3:311 "Likely below 2°C" scenarios used; decline rates based on 10-yr Compound Annual Grown Rate (CAGR)
Projected global natural gas supply and demand
Billion cubic feet per day
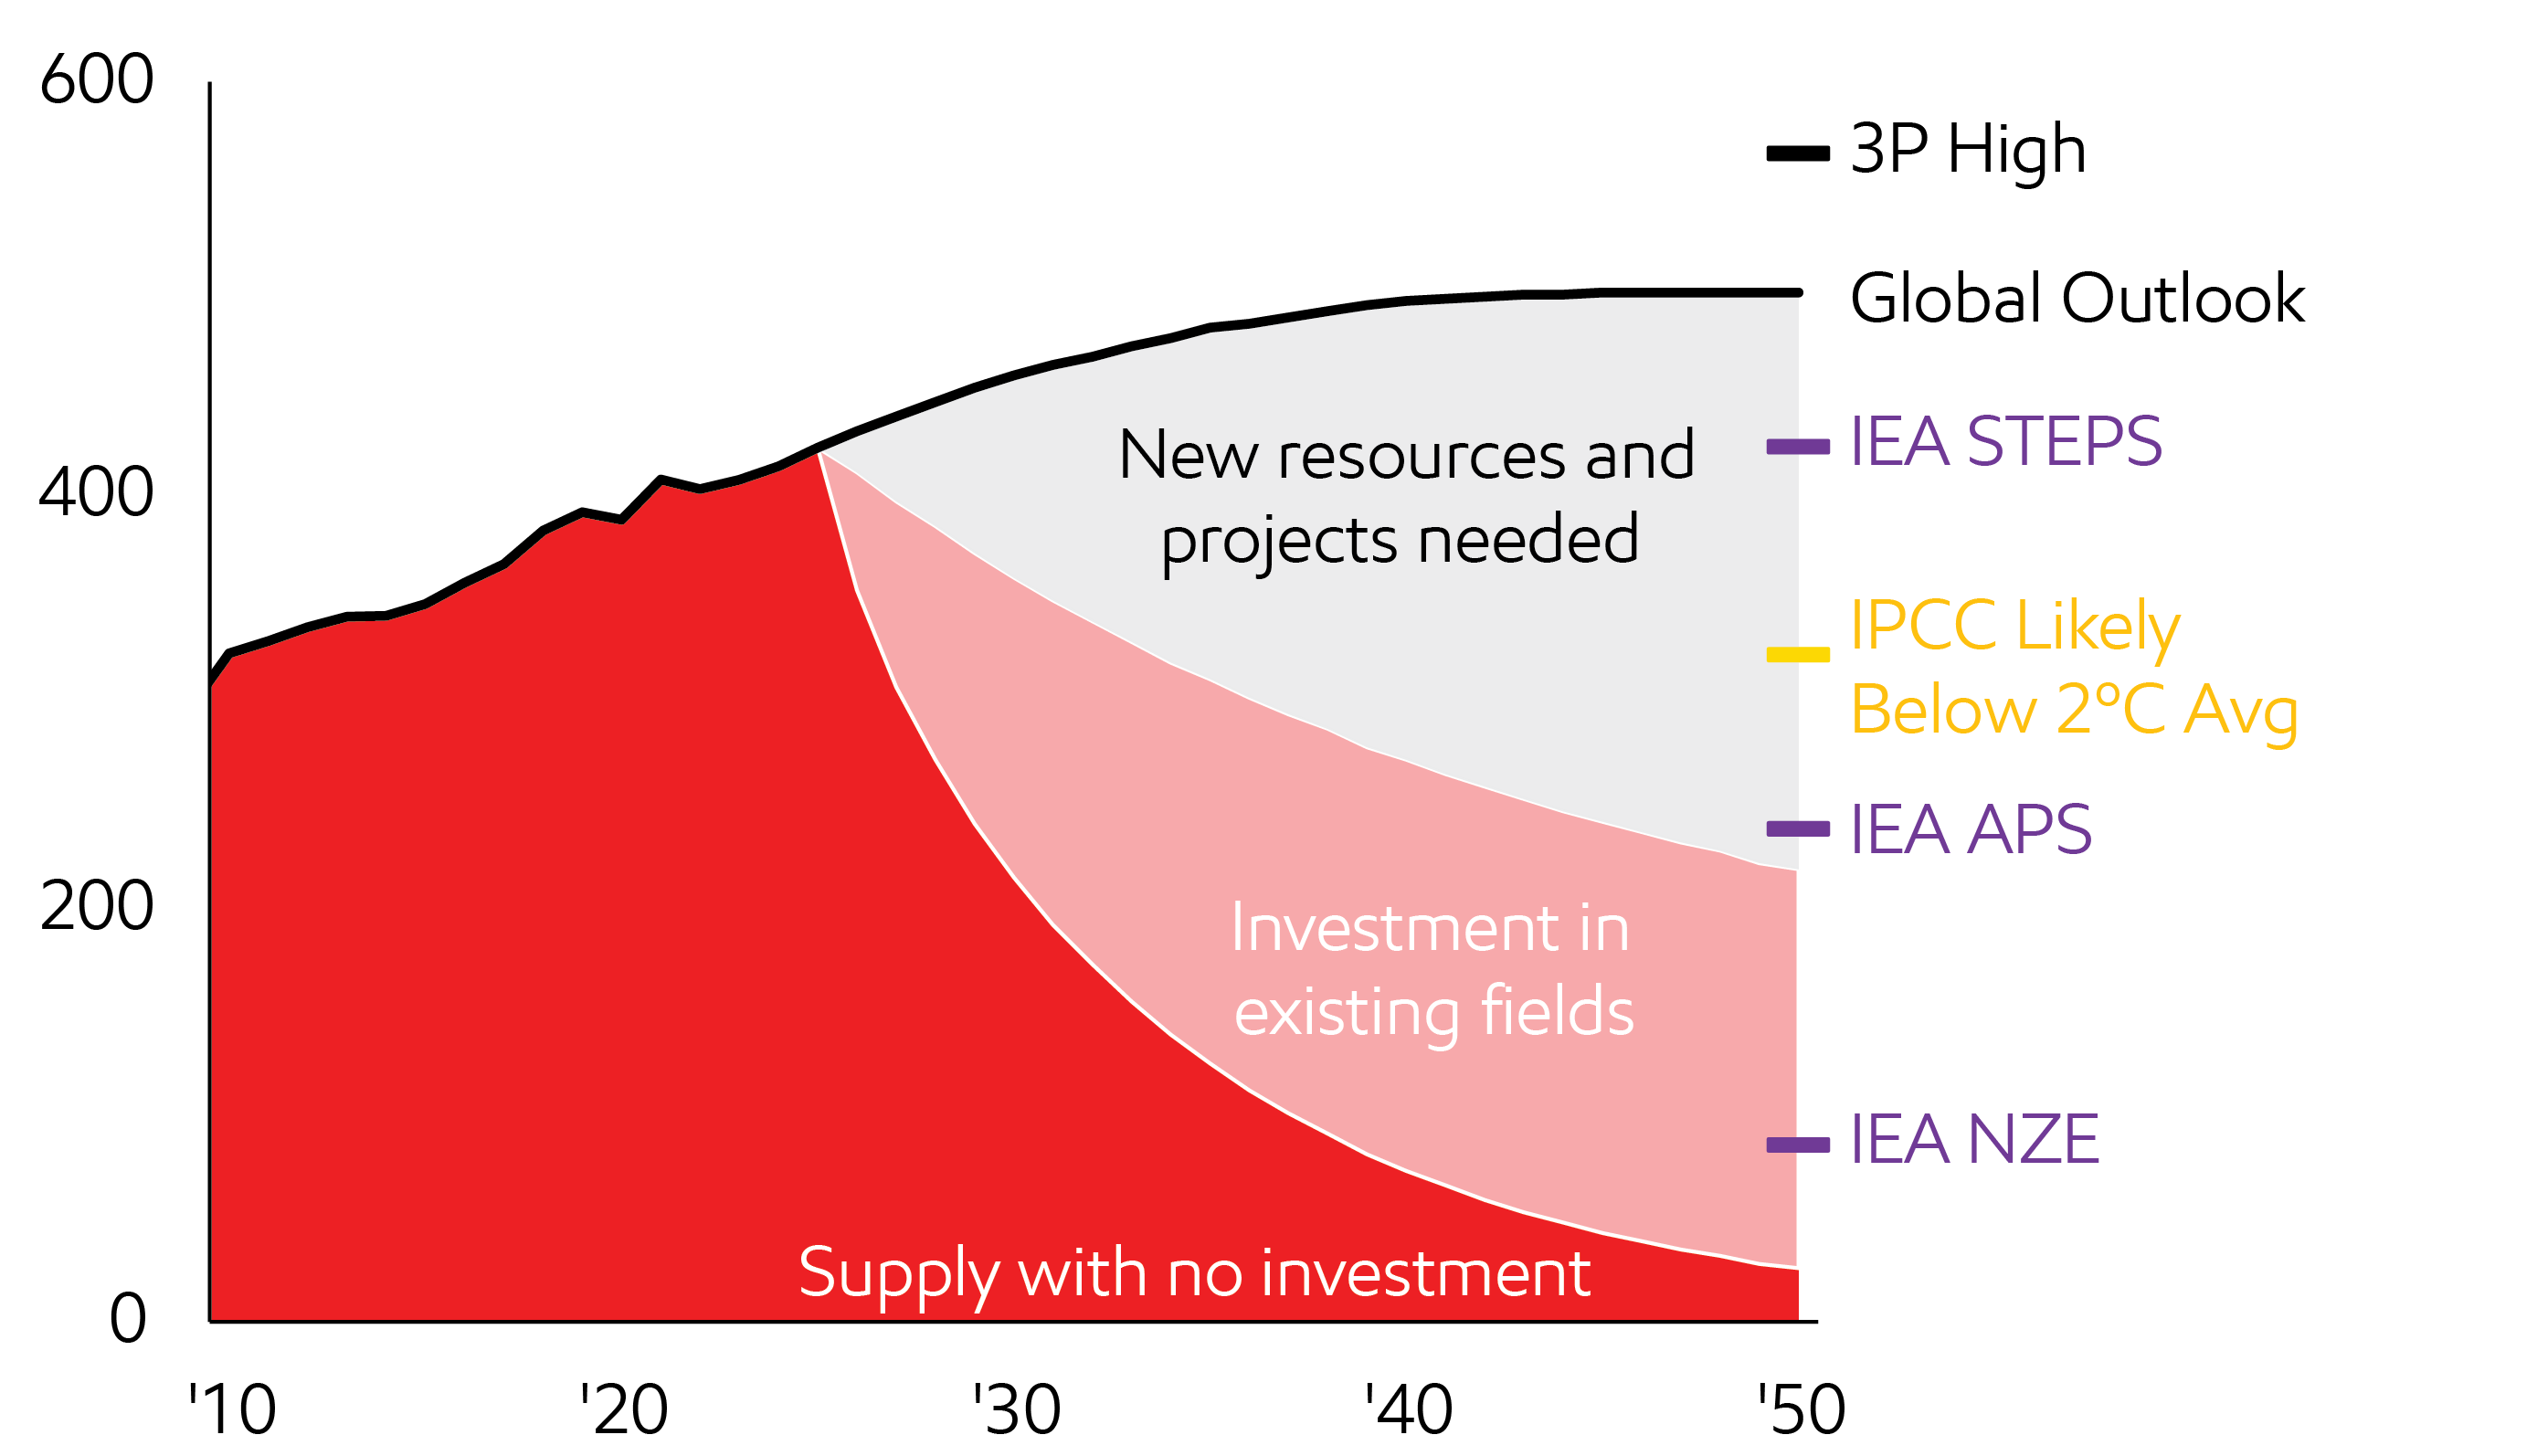
Source: Form 10-K filing
Excludes flaring; IEA STEPS and IEA NZE Source: IEA WEO 2025; IEA APS Source: IEA WEO 2024; Global Outlook Source: ExxonMobil 2025 Global Outlook; IPCC Likely Below 2°C Average Source: IPCC AR6 Scenarios Database hosted by IIASA release 1.0 average IPCC C3: 311 "Likely below 2°C" scenarios used; decline rates based on 10-yr CAGR
Even in extreme lower-demand scenarios, sustained investment will be needed in oil and natural gas to meet the world’s energy demand.27 That’s just to offset the natural decline rate of oil and natural gas production – necessary to avoid supply shortages that would impact people’s lives and hamper global prosperity.
Our Global Outlook estimates oil production naturally declines at a rate of about 15% per year. If global oil and gas investment stopped today, our Global Outlook predicts existing wells would decline rapidly. In just five years, the world would likely face a supply shortfall of roughly 70 million barrels per day, causing severe shortages, extreme price spikes, and deep global economic disruption. The resulting job losses could exceed anything seen since the Great Depression. Limiting investment to existing fields would be less catastrophic, but it would still lead to supply well below the average demand projected in even the IPCC Likely Below 2°C scenario in 2050.
As economies grow and consume more energy, global carbon emissions are nonetheless expected to fall for the first time by 2030. In fact, our Global Outlook projects carbon emissions declining through 2050 due to increases in efficiency, renewables, and lower-emission technologies.
Pricing
Our near-term price assumptions for oil and natural gas are informed by market conditions. For mid- to longer term, our prices are in the range of third-party projections published by reputable organizations with significant industry expertise. While our projections for prices are proprietary, they fall well within historical bands.28
Third-party price projections29

Policy impact
Our Global Outlook seeks to identify how climate-related policies might affect global energy demand. To estimate these potential impacts, we use various tools and assumptions, including a proxy cost of carbon.
We also use proprietary greenhouse gas pricing where we operate and invest. Where existing policies provide greenhouse gas pricing, we consider them when evaluating investments and estimate costs, where appropriate, for specific greenhouse gas emissions sources.
International accords and underlying regional and national regulations covering greenhouse gas emissions continue to evolve, and their timing, outcome, and potential business impacts remain uncertain. Where no such policies exist, we assume a price informed by our Global Outlook.
GHG emissions pricing where ExxonMobil operates or invests
| World Bank30 carbon prices |
EM GHG emissions prices |
IEA WEO STEPS31 CO2 prices |
||
| ($ metric ton CO2 - 2025$ Real) |
2025-2050 | 2035 | 2050 | |
| Advanced economies |
2-145 | 9-150 | <130 | <179 |
| Emerging economies |
1-12 | 4-60 | <23 | <35 |
Ranges provided for jurisdictions where ExxonMobil operates or invests.
ExxonMobil’s GHG emissions pricing for 2025-2030 is based on currently stated existing or anticipated policies; pricing for 2030-2050 reflects presumed regional policies for both advanced and emerging economies.
ExxonMobil’s GHG emissions pricing is in 2025 USD and has not been adjusted for future inflation.
For 2025 and 2026, we have not applied GHG emission prices to our operations or investments in countries where there is no existing GHG emission price. We do apply anticipated prices within the range identified in the table in those countries beginning in 2027.
ExxonMobil’s GHG emissions prices include CO2 and other GHGs (e.g., methane), where appropriate.
Publications
Explore more

Governance and risk management
Report
•
8 min read
• May 5, 2026
Research and development
Report
•
6 min read
• May 5, 2026
Driving reductions in methane emissions
Report
•
6 min read
• May 5, 2026
Rational and constructive policy
Report
•
8 min read
• May 5, 2026
Growing Low Carbon Solutions
Report
•
8 min read
• May 5, 2026FOOTNOTES:
- New businesses earnings potential is based on internal assessment of ExxonMobil’s ability to capture Total Addressable Market potential. Roughly $13 billion of earnings potential by 2040 is subject to additional investment by ExxonMobil.
- Middle East and related disruptions to throughput may affect progress of our planned methane-intensity reductions in 2026; however, ExxonMobil’s 2030 methane-intensity reduction plan remains unchanged. Intensity is calculated as emissions per metric ton of throughput/production. ExxonMobil’s emission-reduction plans are based on Scope 1 and Scope 2 emissions from operated assets. ExxonMobil reported emissions, reductions, and avoidance performance data are based on a combination of measured and estimated emissions data using reasonable efforts and collection methods. Calculations are based on industry standards and best practices, including guidance from the American Petroleum Institute (API) and Ipieca. There is uncertainty associated with the emissions, reductions, and avoidance performance data due to variation in the processes and operations, the availability of sufficient data, quality of those data, and methodology used for measurement and estimation. Performance data may include rounding. Changes to the performance data may be reported as part of the Company’s annual publications as new or updated data and/or emission methodologies become available. We are working to detect, measure and address greenhouse gas emissions. ExxonMobil works with industry, including API and Ipieca, to improve emission factors and methodologies, including measurements and estimates.
- Existing ExxonMobil operated facilities; excludes construction and startup phase of major new facilities. Projected emission intensity includes Scope 1 and 2 emissions of ExxonMobil operated assets as compared to available benchmark. Reduction estimates provided herein have a high degree of uncertainty, and are subject to change based on potential future conditions. 2030 first quartile projection based on comparison of available peer performance data, publicly available announcements, third-party sources (Rystad for oil and flowing gas, Alberta Government for heavy oil, Phillip Townsend and Associates Inc. for LNG), and ExxonMobil analysis.
- References to routine flaring herein are consistent with the World Bank’s Zero Routine Flaring by 2030 Initiative/Global Flaring & Methane Reduction (GFMR) Partnership principle of routine flaring, and excludes safety and non-routine flaring.
- ExxonMobil 2025 Global Outlook (Aug. 28, 2025)
- Papua New Guinea and Mozambique projects are subject to final investment decision.
- ExxonMobil existing facilities. First quartile operated performance based on Phillip Townsend and Associates Inc. industry benchmarking analysis for operating year 2023.
- Aggregate based on Scope 1 and 2 emissions of ExxonMobil operated assets. Refining performance results based on ExxonMobil analysis of 2024 Solomon Associates’ proprietary Carbon Emissions Index; Chemicals performance results based on ExxonMobil analysis of key competitors’ publicly available information, annual data (2016-2024). Benchmarking is updated regularly as new data sources become available.
- ExxonMobil 2025 Global Outlook (Aug. 28, 2025)
- Ibid.
- The utility-scale solar farm is owned and operated by Lightsource bp with power supplied to GCGV under a long-term contract: https://www.gcgv.com/-/media/gcgv/files/2024-sustainability-report/gcgv-sustainability-report-2024.pdf
- Carbon Footprint of Product of Reinforcing Bars: Steel and ProxximaTM Resin containing Glass Fiber Reinforced Polymer (GFRP) in Construction Applications, May 2025, prepared by ExxonMobil Technology and Engineering Company. The study was conducted to be in accordance with ISO 14067:2018 (Greenhouse gases – Carbon footprint of products – Requirements and guidelines for quantification). The study was confirmed to be conducted according to and in compliance with ISO 14067:2018 by an independent third party (Sphera Solutions, Inc.) critical review which followed ISO 14071:2024 to support comparative environmental footprint communications as defined in ISO 14026:2018.
- McKinsey analysis of alternative graphitization processes for battery anode materials.
- ExxonMobil analysis based on: Elizabeth Avery, Experience Nduagu, Eric Vozzola, Timothee W. Roux, Rafael Auras, Polyethylene packaging and alternative materials in the United States: A life cycle assessment, Science of The Total Environment, Volume 961, 2025, 178359,ISSN 0048-9697, https://doi.org/10.1016/j.scitotenv.2024.178359. Manfred Tacker, Tasja Hafner-Kuhn, Andrin Gstöhl, Experience Nduagu, Eric Vozzola, Timothee W. Roux, Rafael Auras, Life cycle assessment of polyethylene packaging and alternatives on the European market, Cleaner Environmental Systems, Volume 17, 2025,100270, ISSN 2666-7894, https://doi.org/10.1016/j.cesys.2025.100270
- Based on performance of specific ExxonMobil ExceedTM XP grades versus conventional polyethylene in flexible packaging applications.
- Comparative Carbon Footprint of Product - ExxonMobil’s ProxximaTM Resin System to Alternative Resin Systems, June 2023, prepared by Sphera Solutions, Inc. for ExxonMobil Technology and Engineering Company. The study was confirmed to be conducted according to and in compliance with ISO 14067:2018 by an independent third party critical review panel. For more information, visit https://www.proxxima.com/en/what-is-proxxima/sustainability
- Department of Energy statements at https://www.energy.gov/eere/vehicles/lightweight-materials-cars-and-trucks
- Based on ExxonMobil analysis: https://www.exxonmobilchemical.com/en/resources/library/library-detail/91254/properly_inflated_tires_affect_energy_consumption_en
- Provides up to 4% fuel economy improvement when changing from a higher viscosity 5W-30 engine oil. Based on ExxonMobil analysis when compared to conventional mineral oils: https://www.mobil.com/en-be/passenger-vehicle-lube/pds/eu-xx-mobil-1-esp-x2-0w-20
- Based on ExxonMobil analysis using Argonne National Labs’ GREET2023 model and published fuel carbon intensity from California LCFS regulations. Argonne National Laboratory GREET model: https://greet.anl.gov/, California Air Resources Board Low Carbon Fuel Standard Regulation: https://ww2.arb.ca.gov/our-work/programs/low-carbon-fuel-standard/lcfs-regulation
- Based on ExxonMobil analysis using Argonne National Labs’ GREET2022 model versus conventional fuel oil. Argonne National Laboratory GREET model: https://greet.anl.gov/ Performance dependent on blend rates and bio components used.
- Based on ExxonMobil analysis; performance profile at https://www.mobil.com/en-us/industrial/pds/na-xx-mobil-dte-10-excel-series
- Based on ExxonMobil analysis; performance profile at https://www.mobil.com/en-us/industrial/pds/na-xx-mobil-shc-600-series
- Based on ExxonMobil analysis; performance profile at https://www.mobil.com/en-us/industrial/pds/gl-xx-mobilshc-gear-320-wt
- Optimizing current production based on product demand, compliance requirements, and supplier capabilities for both the renewable feedstock and also the required hydrogen for processing.
- IEA World Energy Outlook 2025, ExxonMobil analysis, ExxonMobil 2025 Global Outlook, IPCC Sixth Assessment Report, Likely Below 2°C scenarios refers to Category C3.
- ExxonMobil analysis based on IEA (2023), World Energy Outlook 2023, IEA, Paris https://www.iea.org/reports/world-energy-outlook-2023, Licence: CC BY 4.0 (report); CC BY NC SA 4.0 (Annex A)
- For example, from 2010 to 2025, annual Brent crude prices ranged from $112 a barrel to $42 a barrel. For the same period, annual Henry Hub natural gas price ranged between $6.45/mmbtu and $2.03/mmbtu. Source: U.S. EIA Brent and Henry Hub Annual Spot Price (nominal dollars).
- Third-party oil price range includes projections from Wood Mackenzie, IHS Markit, S&P Platts, Rystad Energy, and Facts Global Energy, and the U.S. EIA, and is based on their most current publications as of December 2025. Third-party gas price range includes projections from Wood Mackenzie, IHS Markit, S&P Platts, Rystad Energy, and the U.S. EIA, and is based on their most current publications as of December 2025.
- World Bank: State and Trends of Carbon Pricing 2025, https://openknowledge.worldbank.org/entities/publication/e5f6e755-e6a6-4d2c-927a-23b5cc8a9b03. Reference World Bank ranges are consistent with existing carbon pricing for those jurisdictions as of April 1, 2025.
- IEA World Energy Outlook 2025. IEA ranges have been adjusted for 2025$ Real.
FORWARD-LOOKING STATEMENT WARNING
CAUTIONARY STATEMENT RELEVANT TO FORWARD LOOKING INFORMATION FOR THE PURPOSE OF THE “SAFE HARBOR” PROVISIONS OF THE PRIVATE SECURITIES LITIGATION REFORM ACT OF 1995 AND OTHER IMPORTANT LEGAL DISCLAIMERS
Images or statements of future ambitions, aims, aspirations, plans, goals, events, projects, projections, opportunities, expectations, performance, potential addressable markets or conditions in the publications, including plans to reduce, abate, avoid or enable avoidance of emissions or reduce emissions intensity, sensitivity analyses, estimates, the development of future technologies, business plans, and sustainability efforts are dependent on future market factors, such as customer demand, continued technological progress, stable policy support and timely rule-making or continuation of government incentives and funding, and represent forward-looking statements. Similarly, emission-reduction roadmaps to drive toward net zero and similar roadmaps for emerging technologies and markets, and water management roadmaps to reduce freshwater intake and/or manage disposal, are forward-looking statements. These statements are not guarantees of future corporate, market or industry performance or outcomes for ExxonMobil or society and are subject to numerous risks and uncertainties, many of which are beyond our control or are even unknown.
Actual future results, including the achievement of ambitions to reach Scope 1 and 2 net zero from operated assets by 2050, to reach Scope 1 and 2 net zero in integrated Upstream Permian Basin unconventional operated assets by 2035, to eliminate routine flaring in-line with World Bank Zero Routine Flaring, to reach near zero methane emissions from operated assets and other methane initiatives to meet ExxonMobil’s greenhouse gas emission reduction plans and goals, divestment and start-up plans, and associated project plans as well as technology advances, including in the timing and outcome of projects to capture, transport and store CO2, produce hydrogen and ammonia, produce lower-emission fuels, produce ProxximaTM systems, produce carbon materials, produce lithium, and use plastic waste as feedstock for advanced recycling; future debt levels and credit ratings; business and project plans, timing, costs, capacities and profitability; resource recoveries and production rates; planned Denbury and Pioneer integrated benefits; detection, measurement and quantification of emissions including obtaining or reporting of that data or updates to previous estimates and progress in sustainability focus areas could vary depending on a number of factors. These include, global or regional changes or imbalances in the supply and demand for oil, gas, petrochemicals, and feedstocks and other market factors; economic conditions and seasonal fluctuations that impact prices, differentials, and volume/mix for our products; new market products and services; future cash flows; our ability to execute operational objectives on a timely and successful basis; the ability to realize efficiencies within and across our business lines; developments or changes in local, national, or international treaties, laws, regulations, taxes, trade sanctions, trade tariffs, or policies affecting our business, such as government policies supporting lower-carbon and new market investment opportunities, or policies limiting the attractiveness of investments such the punitive European taxes on the oil and gas sector and unequal support for different technological methods of emissions reduction or evolving, ambiguous, and unharmonized voluntary and mandatory standards and extraterritorial laws and regulations imposed by various jurisdictions related to sustainability and greenhouse gas reporting and evolving measurement standards for these topics; timely granting of governmental permits, licenses, and certifications; uncertain impacts of deregulation on the legal and regulatory environment; trade patterns and the development and enforcement of local, national and regional mandates; unforeseen technical or operational difficulties; the outcome of research efforts and future technology developments, including the ability to scale projects and technologies such as electrification of operations, advanced recycling, carbon capture and storage, hydrogen and ammonia production, ProxximaTM systems, carbon materials or direct lithium extraction on a commercially competitive basis; the development and competitiveness of alternative energy and emission reduction technologies; unforeseen technical or operating difficulties, including the need for unplanned maintenance; availability of feedstocks for lower-emission fuels, hydrogen, or advanced recycling; changes in the relative energy mix across activities and geographies; the actions of co-venturers or competitors; changes in regional and global economic growth rates and consumer preferences including willingness and ability to pay for reduced emissions products; actions taken by governments and consumers resulting from a pandemic; changes in population growth, economic development or migration patterns; timely completion of construction projects; war, civil unrest, attacks against the Company or industry, and other political or security disturbances, including disruption of land or sea transportation routes; decoupling of economies, realignment of global trade and supply chain networks, and disruptions in military alliances; and other factors discussed here and in Item 1A. Risk Factors of our Annual Report on Form 10-K and under the heading “Factors affecting future results” available under the “Earnings” tab through the “Investors” page of our website at www.exxonmobil.com. The Advancing Climate Solutions Report includes 2025 greenhouse gas emissions performance data as of March 13, 2026, and Scope 3 Category 11 estimates for full year 2025 as of March 13, 2026. The greenhouse gas intensity and greenhouse gas emission estimates include Scope 2 market-based emissions. The Sustainability Report, the Advancing Climate Solutions Report, and combined Executive Summary were issued on May 5, 2026. The content and data referenced in these publications focus primarily on our operations from Jan. 1, 2025 – Dec. 31, 2025, unless otherwise indicated. Tables on our “Metrics and data” page were updated to reflect full year 2025 data. Information regarding some known events or activities in 2026 and historical initiatives from prior years are also included. No party should place undue reliance on these forward-looking statements, which speak only as of the dates of these publications. All forward-looking statements are based on management’s knowledge and reasonable expectations at the time of publication. ExxonMobil assumes no duty to update these statements or materials as of any future date, and neither future distribution of this material nor the continued availability of this material in archive form on our website should be deemed to constitute an update or re-affirmation of these figures or statements as of any future date. Any future update will be provided only through a public disclosure indicating that fact.
See “ABOUT THE ADVANCING CLIMATE SOLUTIONS AND SUSTAINABILITY REPORTS” at the end of this document for additional information on these reports and the use of non-GAAP and other financial measures.
ABOUT THE ADVANCING CLIMATE SOLUTIONS AND SUSTAINABILITY REPORTS
The Advancing Climate Solutions Report contains terms used by the third-party disclosure frameworks. In doing so, ExxonMobil is not obligating itself to use any terms in the way defined or interpreted by any third-party, nor is it obligating itself to comply with any specific recommendation of such parties or to provide any specific disclosure. For example, with respect to the term “material,” individual companies are best suited to determine what information is material, under the long-standing U.S. Supreme Court definition, and whether to include this information in U.S. Securities and Exchange Act filings. The Sustainability Report and Advancing Climate Solutions Report are each a voluntary disclosure and are not designed to fulfill any U.S., foreign, or third-party required reporting framework.
Forward-looking and other statements regarding environmental and other sustainability efforts and aspirations are not intended to communicate any material investment information under the laws of the United States or elsewhere or represent that these are required disclosures in any other context or jurisdiction. These publications are not intended to imply that ExxonMobil has access to any significant non-public insights on future events that the reader could not independently research. In addition, historical, current, and forward-looking environmental, climate-related, and other sustainability-related statements may be based on standards for measuring progress that are still developing, internal controls and processes that continue to evolve, and assumptions that are subject to change in the future, including future laws and rulemaking. Forward-looking and other statements regarding environmental and other sustainability efforts and aspirations are for informational purposes only and are not intended as an advertisement for ExxonMobil’s equity, debt, businesses, products, or services and the reader is specifically notified that any investor-requested disclosure or future required disclosure is not and should not be construed as an inducement for the reader to purchase any product, services, or security. The statements and analysis in these publications represent a good faith effort by the Company to address these investor requests despite significant unknown variables and at times inconsistent market data, government policy signals, and calculation methodologies and reporting standards.
Actions needed to advance ExxonMobil’s 2030 greenhouse gas emission-reductions plans are incorporated into its medium-term business plans, which are updated annually. The reference case for planning beyond 2030 is based on the Company’s Global Outlook research and publication. The Global Outlook is reflective of the existing global policy environment and an assumption of increasing policy stringency and technology improvement to 2050. However, the Global Outlook does not attempt to project the degree of required future policy and technology advancement and deployment for the world, or ExxonMobil, to meet net zero by 2050. As future policies and technology advancements emerge, they will be incorporated into the GIobal Outlook, and the Company’s business plans will be updated as appropriate. References to projects or opportunities may not reflect investment decisions made by the corporation or its affiliates. Individual projects or opportunities may advance based on a number of factors, including availability of stable and supportive policy, permitting, technological advancement for cost-effective abatement, insights from the company planning process, and alignment with our partners and other stakeholders. Capital investment guidance in lower-emission and other new investments is based on our corporate plan; however, actual investment levels will be subject to the availability and attractiveness of investment opportunities, market conditions, stable public policy support, other factors, and focused on returns.
Energy demand modeling is forward-looking by nature aims to replicate integrated dynamics of the global energy system but necessarily involves simplifications to simulate its complexity. The reference to any modeled scenario or any pathway for an energy transition or expansion, including any potential net-zero scenario, does not imply ExxonMobil views any particular scenario as likely to occur. In addition, energy demand scenarios require assumptions on a variety of parameters. As such, the outcome of any given scenario using an energy demand model comes with a high degree of uncertainty. Third-party scenarios discussed in these reports reflect the modeling assumptions and outputs of their respective authors, not ExxonMobil, and their use or inclusion herein is not an endorsement by ExxonMobil of their underlying assumptions, likelihood, or probability. Investment decisions are made on the basis of ExxonMobil’s separate planning process but may be secondarily tested for robustness or resiliency against different assumptions, including against various scenarios. These reports contain information from third parties. ExxonMobil makes no representation or warranty as to the third-party information. Where necessary, ExxonMobil received permission to cite third-party sources, but the information and data remain under the control and direction of the third parties. ExxonMobil has also provided links in this report to third-party websites for ease of reference. ExxonMobil’s use of the third-party content is not an endorsement or adoption of such information.
ExxonMobil reported emissions, including reductions and avoidance performance data, are based on a combination of measured and estimated data. We assess our performance to support continuous improvement throughout the organization using our Environmental Performance Indicator (EPI) manual. The reporting guidelines and indicators in the Ipieca, the American Petroleum Institute (API), the International Association of Oil and Gas Producers Sustainability Reporting Guidance for the Oil and Gas Industry (5th edition, 2025) and key chapters of the GHG Protocol inform the EPI and the selection of the data reported. Emissions reported are estimates only, and performance data depends on variations in processes and operations, the availability of sufficient data, the quality of those data and methodology used for measurement and estimation. Emissions data is subject to change as methods, data quality, and technology improvements occur, and changes to performance data may be updated. Emissions, reductions, abatements and enabled avoidance estimates for non-ExxonMobil operated facilities are included in the equity data and similarly may be updated as changes in the performance data are reported. ExxonMobil’s plans to reduce emissions are good-faith efforts based on current relevant data and methodology, which could be changed or refined. ExxonMobil works to continuously improve its approach to estimate, detect, measure, and address emissions. ExxonMobil actively engages with industry, including API and Ipieca, to improve emission factors and methodologies, including measurements and estimates.
Any reference to ExxonMobil’s support of, work with, or collaboration with a third-party organization within these publications do not constitute or imply an endorsement by ExxonMobil of any or all of the positions or activities of such organization. ExxonMobil participates, along with other companies, institutes, universities and other organizations, in various initiatives, campaigns, projects, groups, trade organizations, and other collaborations among industry and through organizations like the United Nations that express various ambitions, aspirations and goals related to climate change, emissions, sustainability, and an energy transition or expansion. ExxonMobil’s participation or membership in such collaborations is not a promise or guarantee that ExxonMobil’s individual ambitions, future performance or policies will align with the collective ambitions of the organizations or the individual ambitions of other participants, all of which are subject to a variety of uncertainties and other factors, many of which may be beyond ExxonMobil’s control, including government regulation, availability and cost-effectiveness of technologies, and market forces, geopolitical, realignment, conflicts and other risks and uncertainties. Such third parties’ statements of collaborative or individual ambitions and goals frequently diverge from ExxonMobil’s own ambitions, plans, goals, commitments and investments. ExxonMobil will continue to make independent decisions regarding the operation of its business, including its climate-related and sustainability-related ambitions, plans, goals, commitments, and investments. ExxonMobil’s future ambitions, plans, goals commitments, and investments reflect ExxonMobil’s current plans, and ExxonMobil may unilaterally change them for various reasons, including adoption of new reporting standards or practices, market conditions; changes in its portfolio; and financial, operational, regulatory, reputational, legal and other factors.
References to “resources,” “resource base,” and similar terms refer to the total remaining estimated quantities of oil and natural gas that are expected to be ultimately recoverable. The resource base includes quantities of oil and natural gas classified as proved reserves, as well as quantities that are not yet classified as proved reserves, but that are expected to be ultimately recoverable. The term “resource base” is not intended to correspond to SEC definitions such as “probable” or “possible” reserves. For additional information, see the “Frequently Used Terms” on the Investors page of the Company’s website at www.exxonmobil.com under the header “Modeling Toolkit.” References to “oil” and “gas” include crude, natural gas liquids, bitumen, synthetic oil, and natural gas. The term “project” as used in these publications can refer to a variety of different activities and does not necessarily have the same meaning as in any government payment transparency reports.
Exxon Mobil Corporation has numerous affiliates, many with names that include ExxonMobil, Exxon, Mobil, Esso, and XTO. For convenience and simplicity, those terms and terms such as “Corporation,” “company,” “our,” “we,” and “its” are sometimes used as abbreviated references to one or more specific affiliates or affiliate groups. Abbreviated references describing global or regional operational organizations, and global or regional business lines are also sometimes used for convenience and simplicity. Nothing contained herein is intended to override the corporate separateness of affiliated companies. Exxon Mobil Corporation’s goals do not guarantee any action or future performance by its affiliates or Exxon Mobil Corporation’s responsibility for those affiliates’ actions and future performance, each affiliate of which manages its own affairs. For convenience and simplicity, words like venture, joint venture, partnership, co-venturer and partner are used to indicate business relationships involving common activities and interests, and those words may not indicate precise legal relationships. These publications cover Exxon Mobil Corporation’s owned and operated businesses and do not address the performance or operations of our suppliers, contractors or partners unless otherwise noted. In the case of certain joint ventures for which ExxonMobil is the operator, we often exercise influence but not control. Thus, the governance, processes, management and strategy of these joint ventures may differ from those in these reports. ExxonMobil completed the acquisitions of Denbury Inc. and Pioneer Natural Resources Company in 2023 and 2024, respectively. These reports and the data therein do not speak of these companies’ pre-acquisition governance, risk management, strategy approaches, or emissions or sustainability performance unless specifically referenced.
These reports or any material therein are not to be used or reproduced without the permission of Exxon Mobil Corporation. All rights reserved
SUPPLEMENTAL INFORMATION FOR NON-GAAP AND OTHER MEASURES
The Positioned for Growth in a Lower-Emission Future section of the Advancing Climate Solutions Report mentions our assessment of the strength our business and investment portfolio against a range of future outcomes, including third-party scenarios. The Company believes this can be helpful in assessing the resiliency of the business to generate cash from different potential future markets. The performance data presented in the Advancing Climate Solutions Report and Sustainability Report, including on emissions, is not financial data and is not GAAP data.