Report
8 min read
• May 5, 2026Advancing Climate Solutions and Sustainability Executive Summary
Report
8 min read
• May 5, 2026Navigate to:
Solving the “and” equation –
Meeting demand and reducing emissions
Climate change is real, and the challenge is more complex – and the range of solutions more broad – than most conversations acknowledge.
Rising populations and growing economies continue to need more energy, not less. We’re working to increase the supply of reliable, affordable energy even as we lower GHG emissions.
Both sides of this equation are more important than ever.
~2x
Global GDP in 2050 as developing nations grow~50%
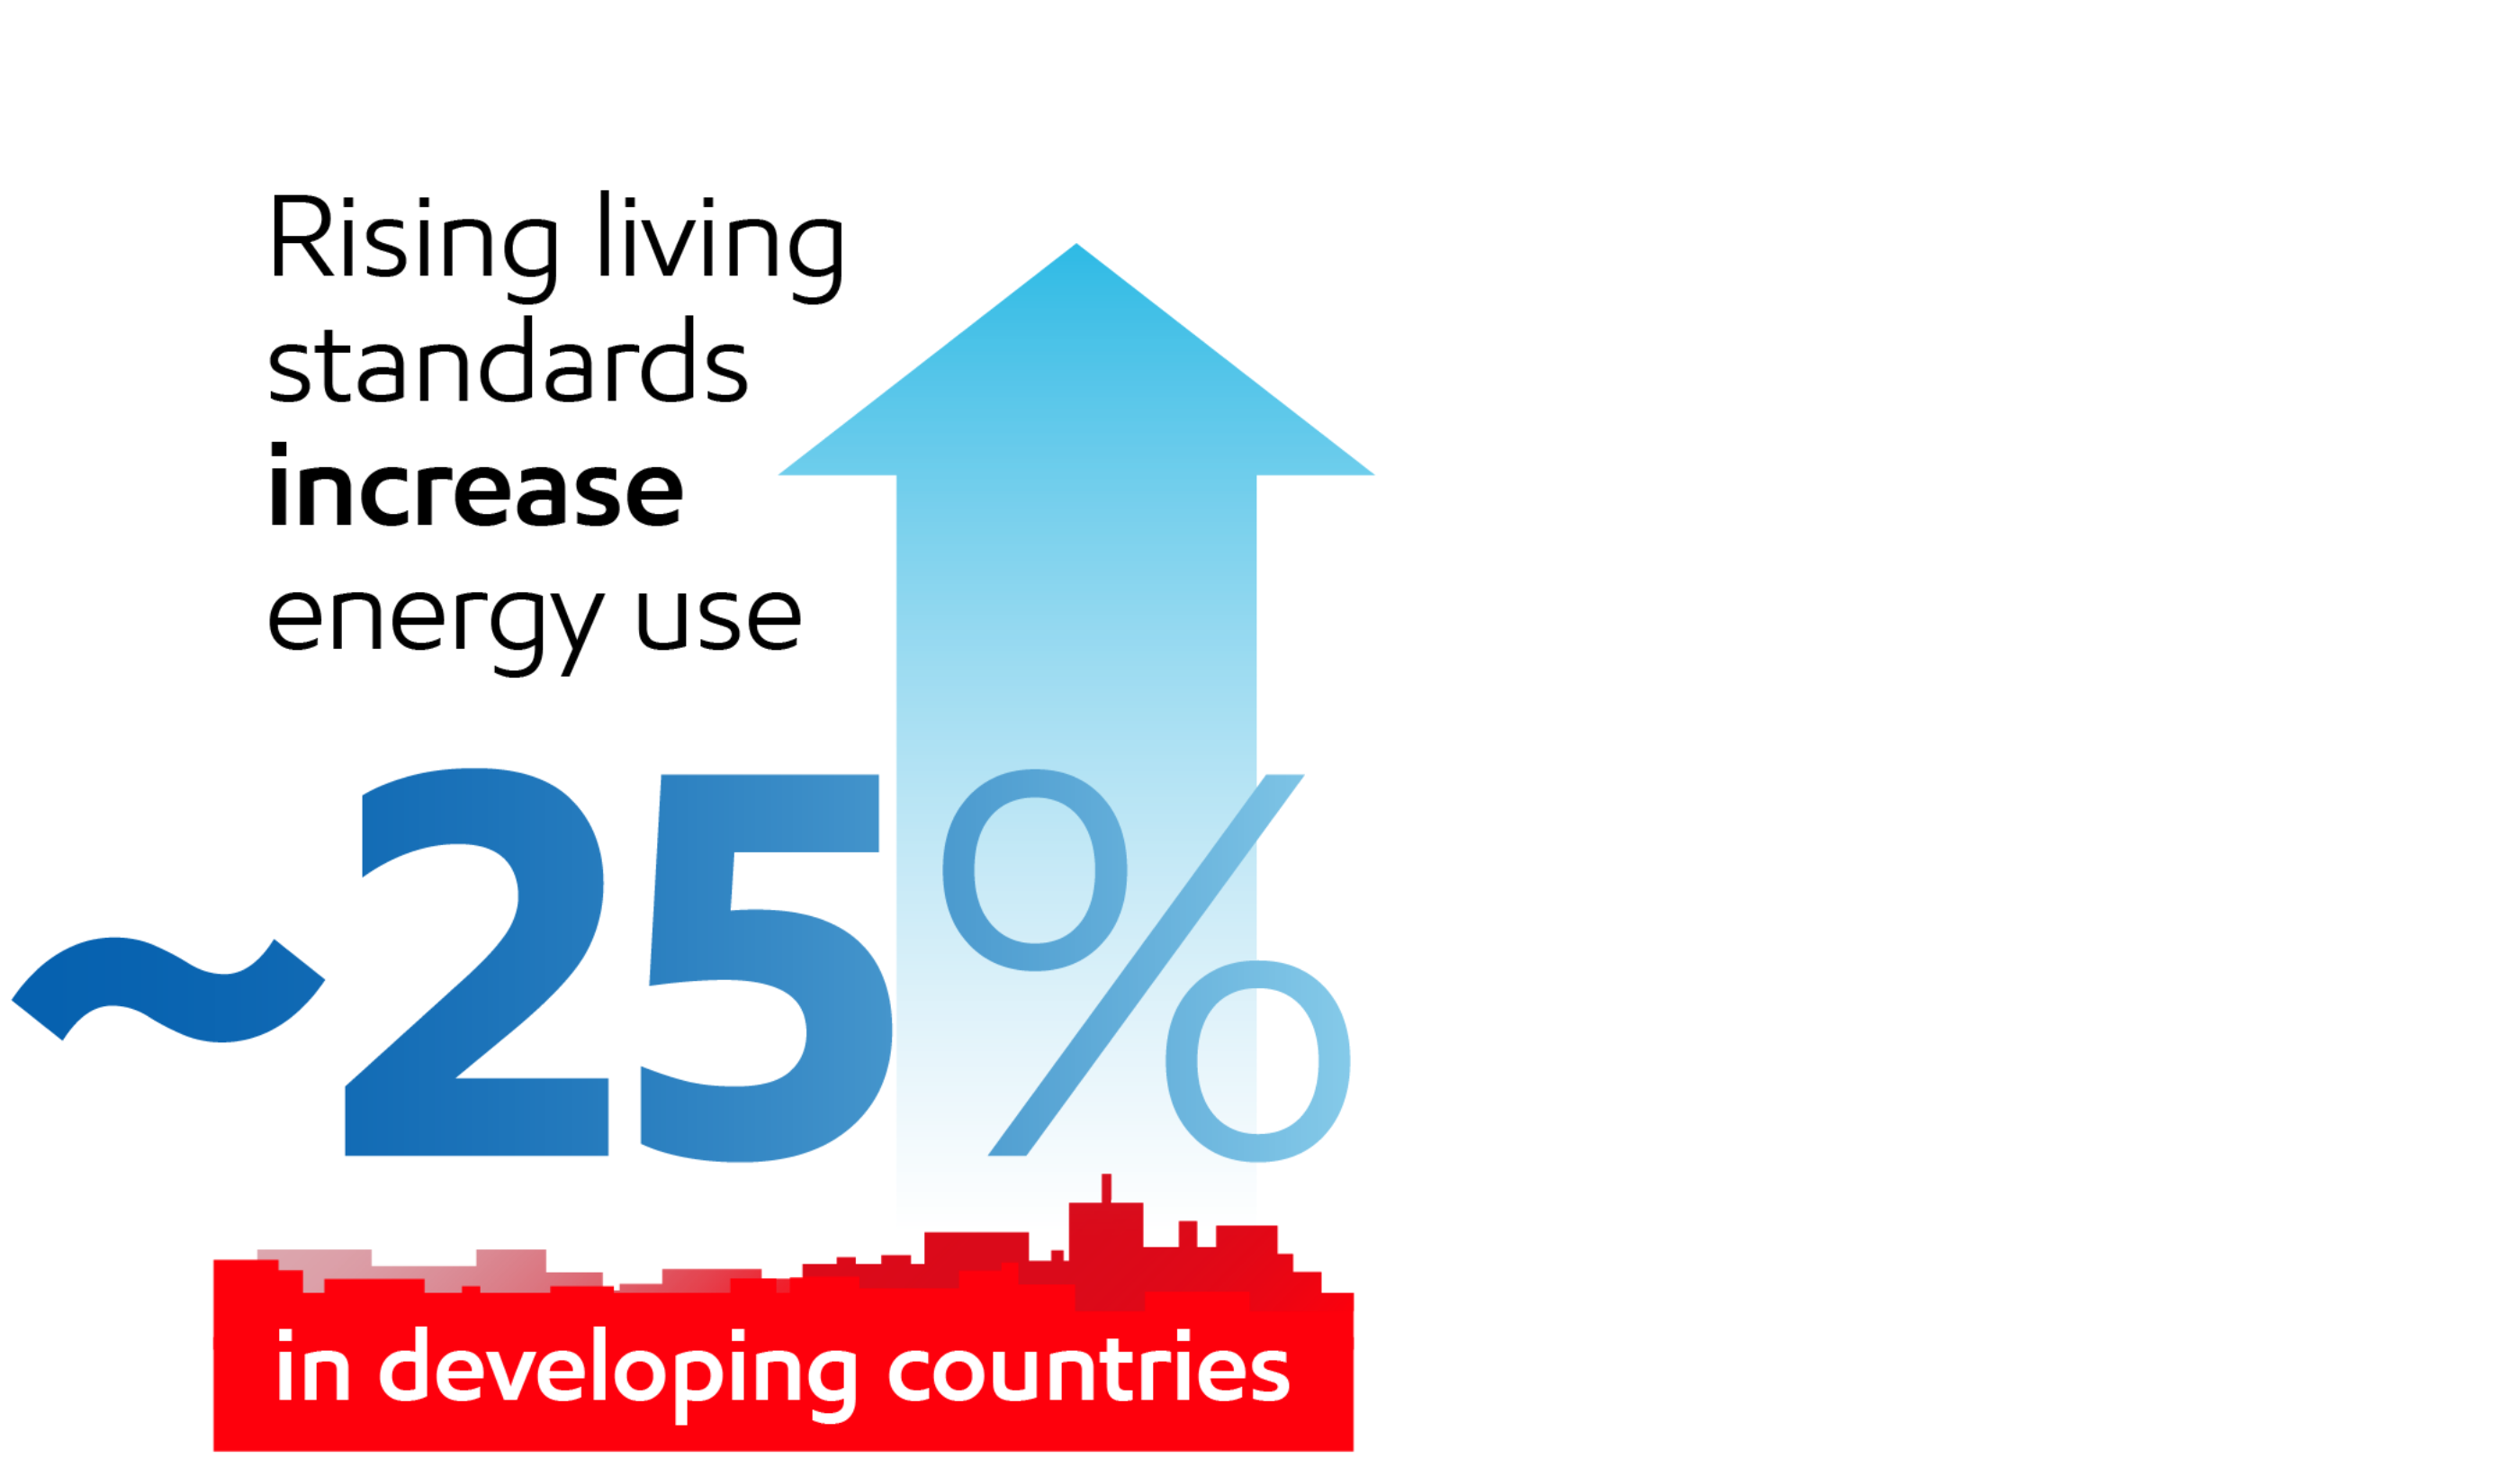
of today's population lacks energy for basic needs~25%
increase in energy use in developing countries by 2050~25%
decrease in global CO2 emissions by 2050
2025 Global Outlook1
Energy poverty remains far too common, and worldwide GHG ambitions remain out of reach. The world is still not on track to achieve universal access to clean cooking fuels by 2030,2 and the International Energy Agency now describes a 1.5°C increase in global temperatures as inevitable.3
The world will need more technologies delivering more energy to more people, with more ways to reduce GHG emissions across every sector.
Add it up, and one thing becomes clear: Any energy transition will fundamentally be an energy expansion.
“Society’s evolving needs and a potential energy transition are tremendous opportunities. In any future, ExxonMobil will have an important role, providing needed solutions and creating substantial shareholder value.”

In our Advancing Climate Solutions and Sustainability reports, we discuss how ExxonMobil’s unmatched set of competitive advantages puts us in a unique position to help bend the curve on GHG emissions and supply the energy the world needs.
Key takeaways
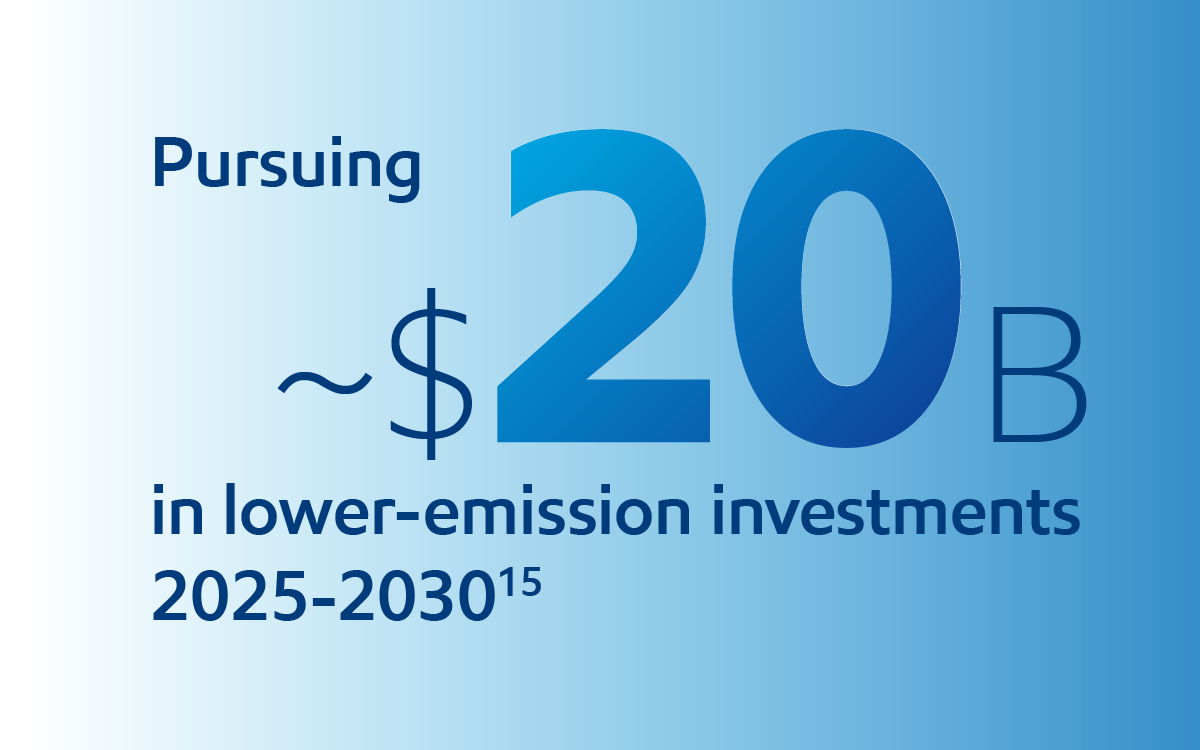
- We’re pursuing ~$20 billion in lower-emission investments from 2025-2030.4
- We’re achieving and beating our 2030 emission-intensity reduction plans.5
- We have a robust business that is positioned to grow in a lower-emission future.
- We're proposing policy solutions that we believe will bring emissions down more effectively and affordably – including supporting a rational framework for carbon emissions accounting.
- We’re hard at work creating sustainable solutions that improve quality of life and meet society’s evolving needs – with a focus on doing the right thing, the right way.
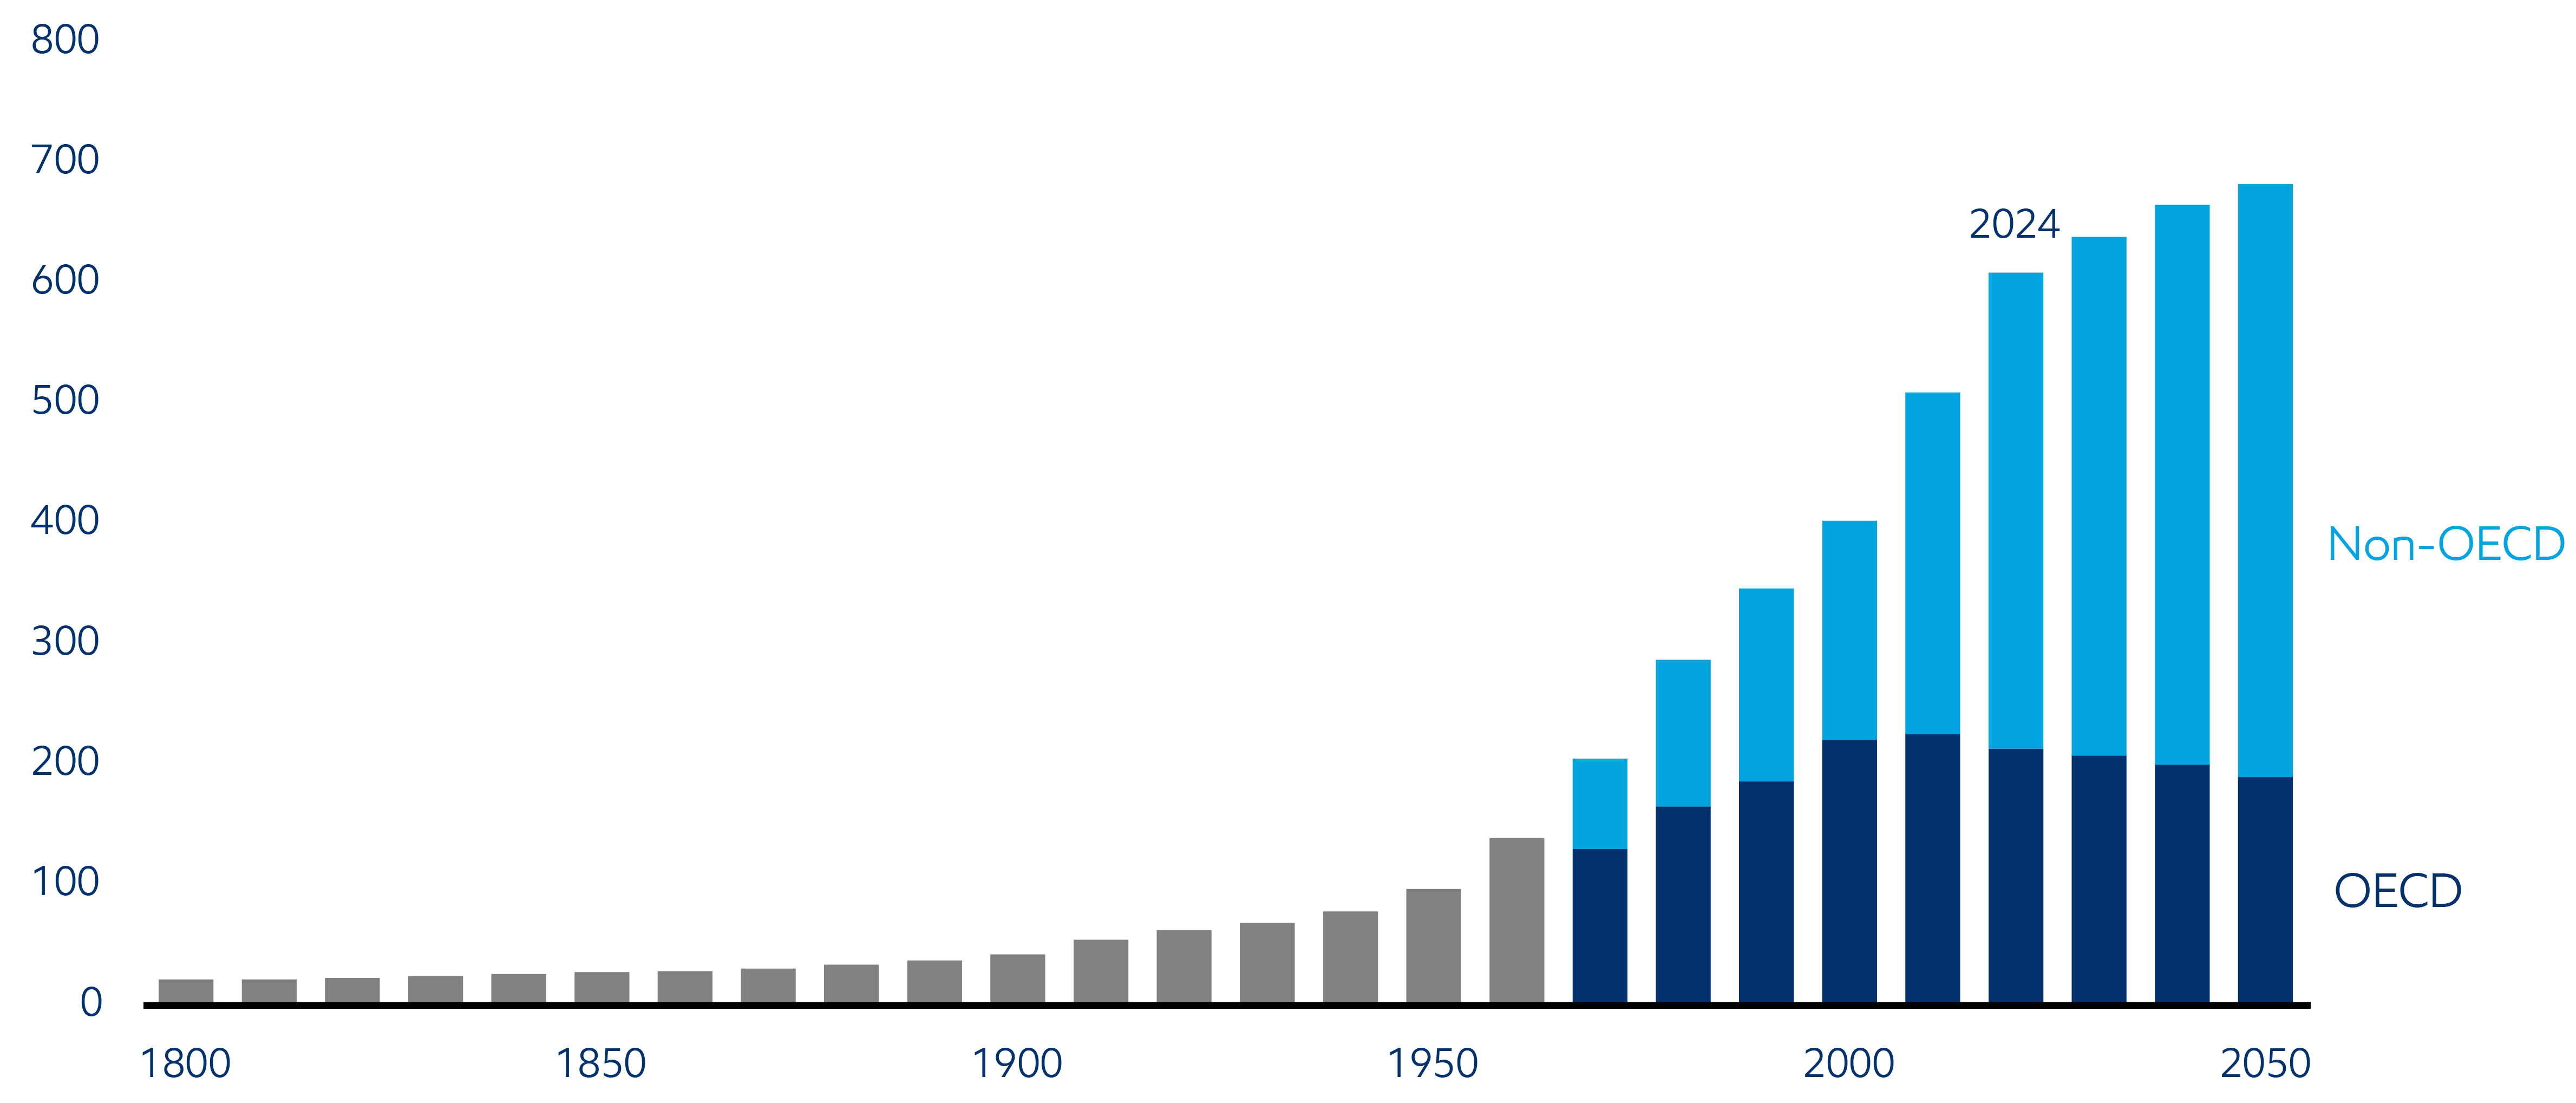
More people will need more energy in 2050 –
But we expect they will emit less to meet their needs
Our Global Outlook projects that global CO2 emissions will begin a sustained decline while economies continue to grow and living standards rise – for the first time since the Industrial Revolution.
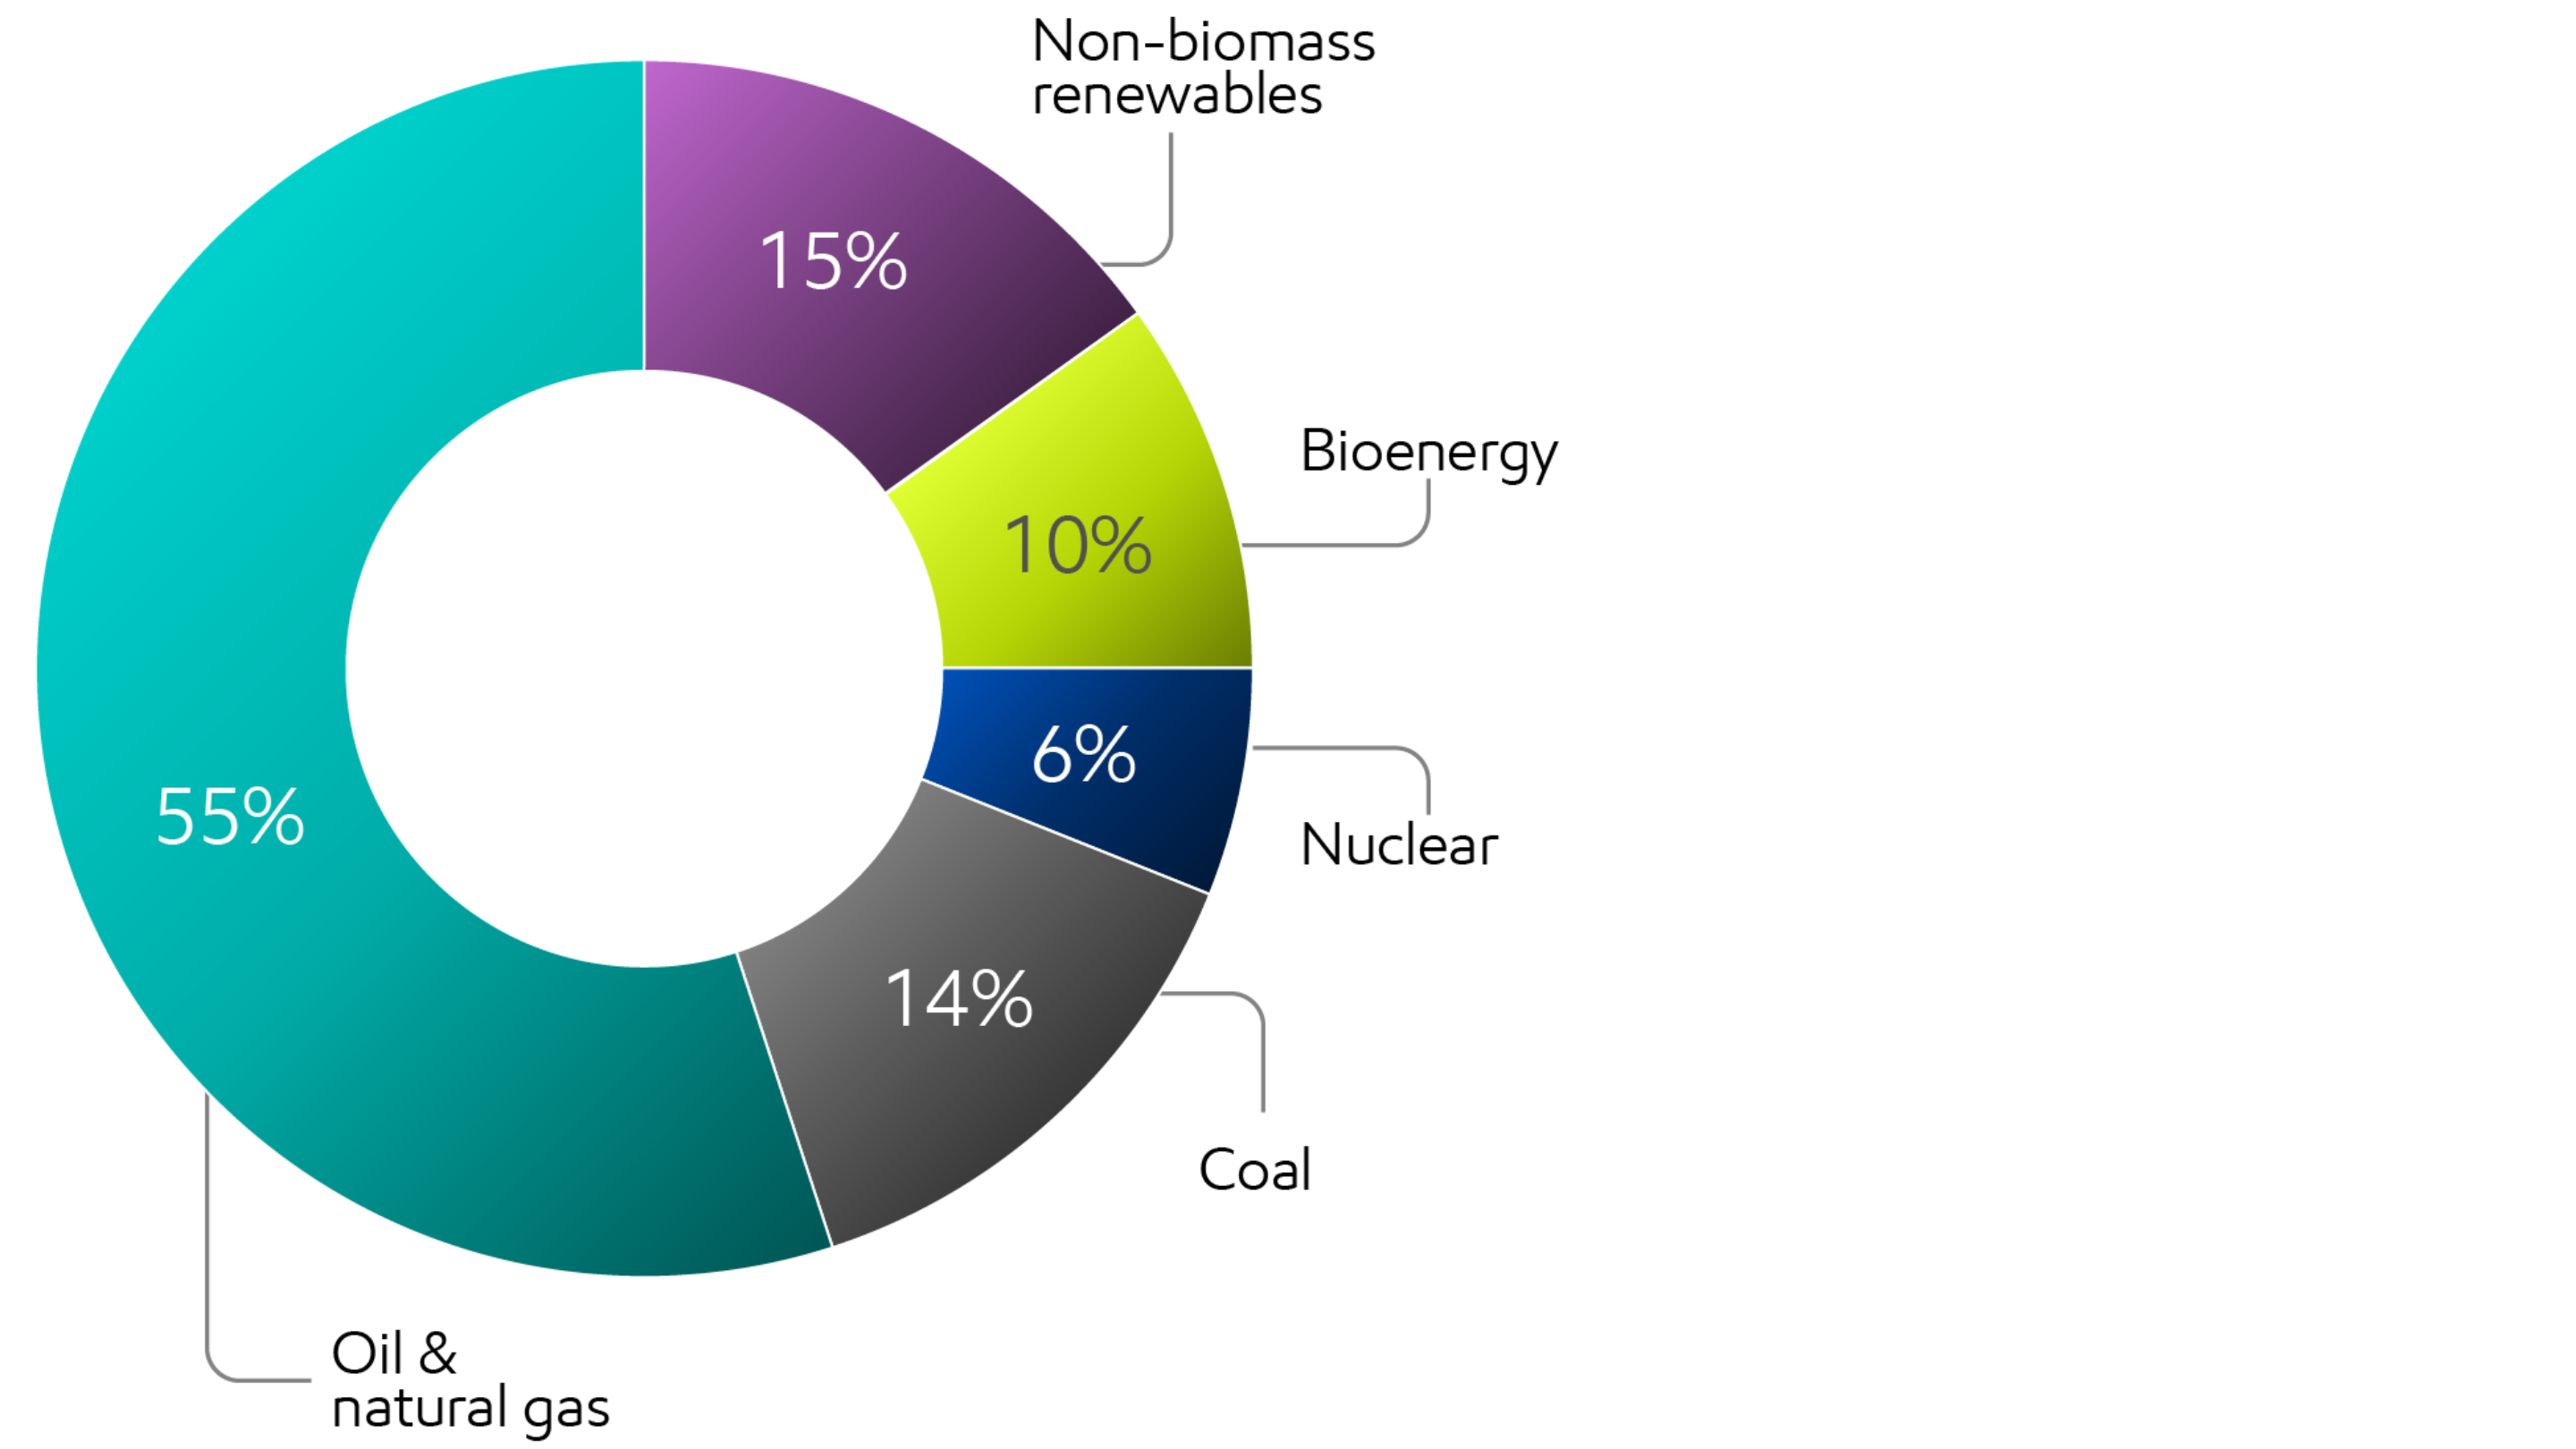
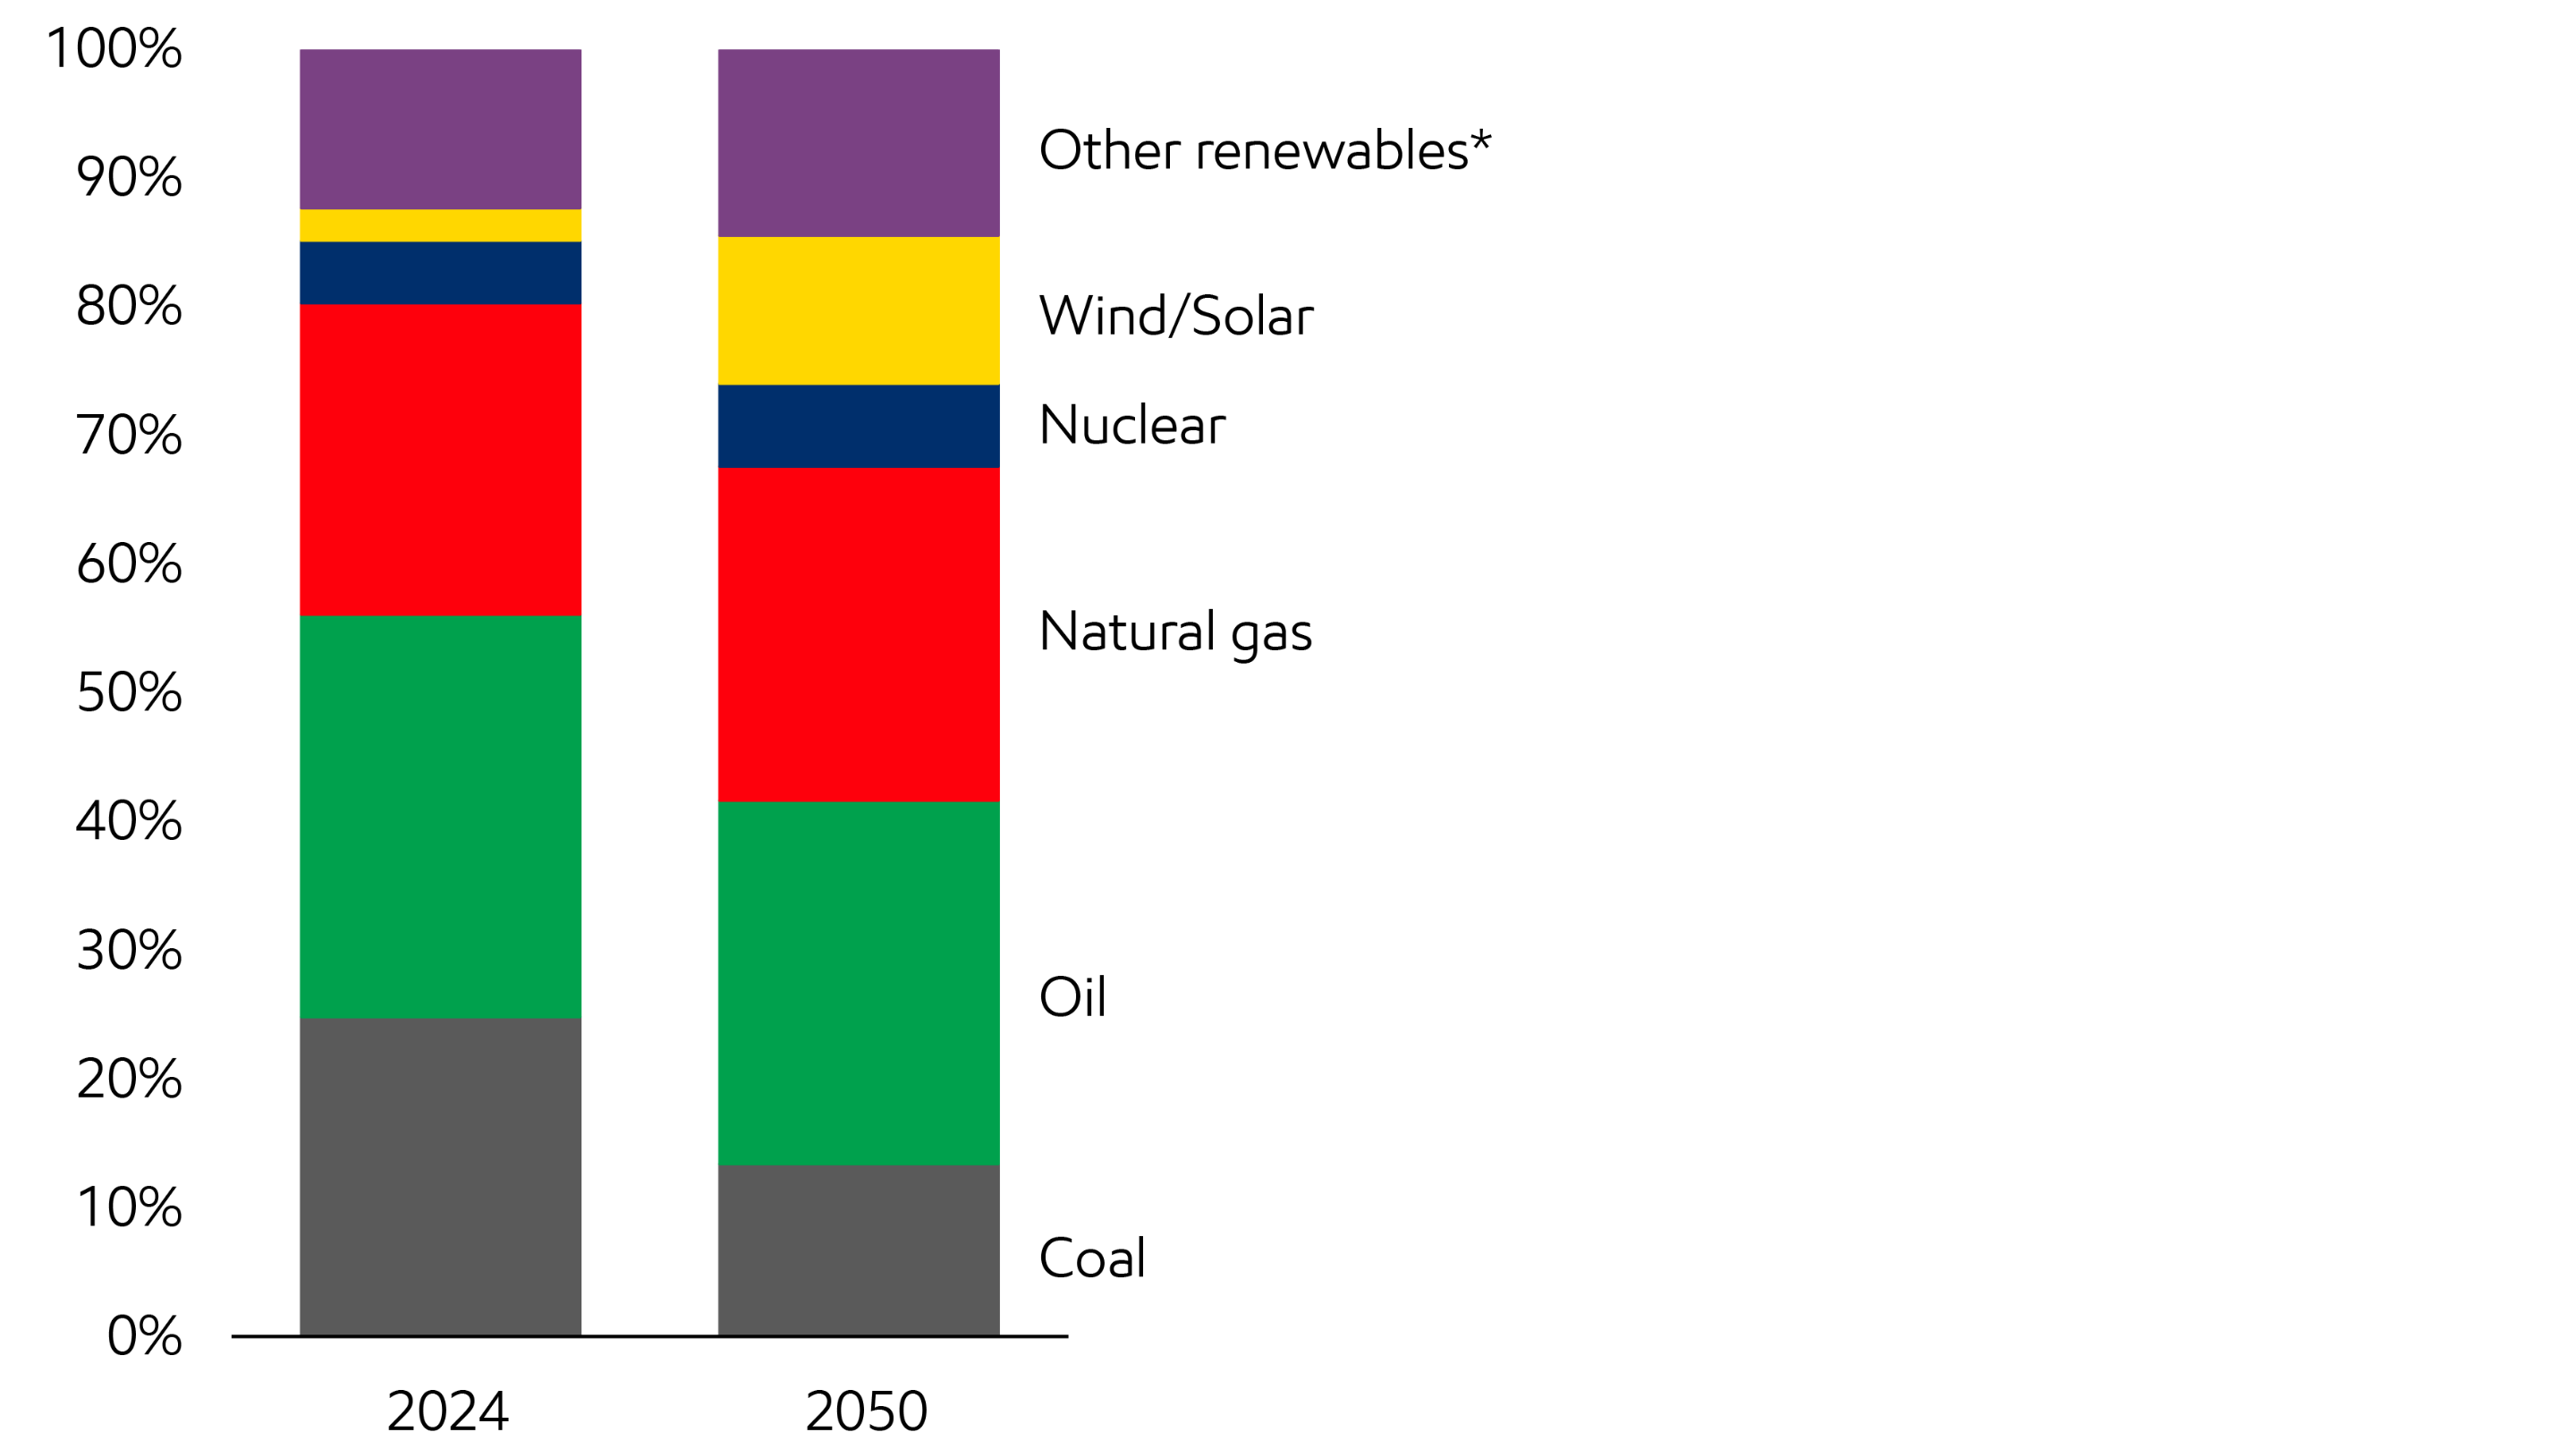
By 2050, emissions are projected to fall about 25% from today’s levels,6 driven by efficiency gains and the wider use of all lower‑emission solutions, including renewables, carbon capture and storage, hydrogen, and biofuels.
Energy-related CO2 emissions are projected to reach roughly 36 billion metric tons per year and then decline to about 27 billion by mid-century.7

For the world to make a real dent in emissions, we need the flexibility to choose from every viable technology and deploy solutions at scale across every sector.
Industry and commercial transportation make up ~40% of global energy-related emissions today and are expected to account for half of energy-related emissions in 2050.8
2050 projected global energy mix
World-scale challenges call for world-scale solutions.
It will take sustained effort to:
- Meet global demand for reliable, affordable energy and products.
- Support economic growth and societal development, especially in developing regions.
- Develop and deploy technologies that can lower GHG emissions efficiently, affordably, and at global scale.
Doing all of this depends on advancing new technologies, supported by constructive policy, while using competitive markets to drive innovation and fund emission‑reducing investments.
Transforming molecules to transform tomorrow –
Uniquely positioned to help bend the curve on emissions
Long before the rise of the tech sector, ExxonMobil was discovering, developing, and deploying game-changing solutions derived from the foundations of modern life: carbon and hydrogen molecules.
Today, we’re transforming how these molecules are used to meet society’s needs.
ExxonMobil's competitive advantages
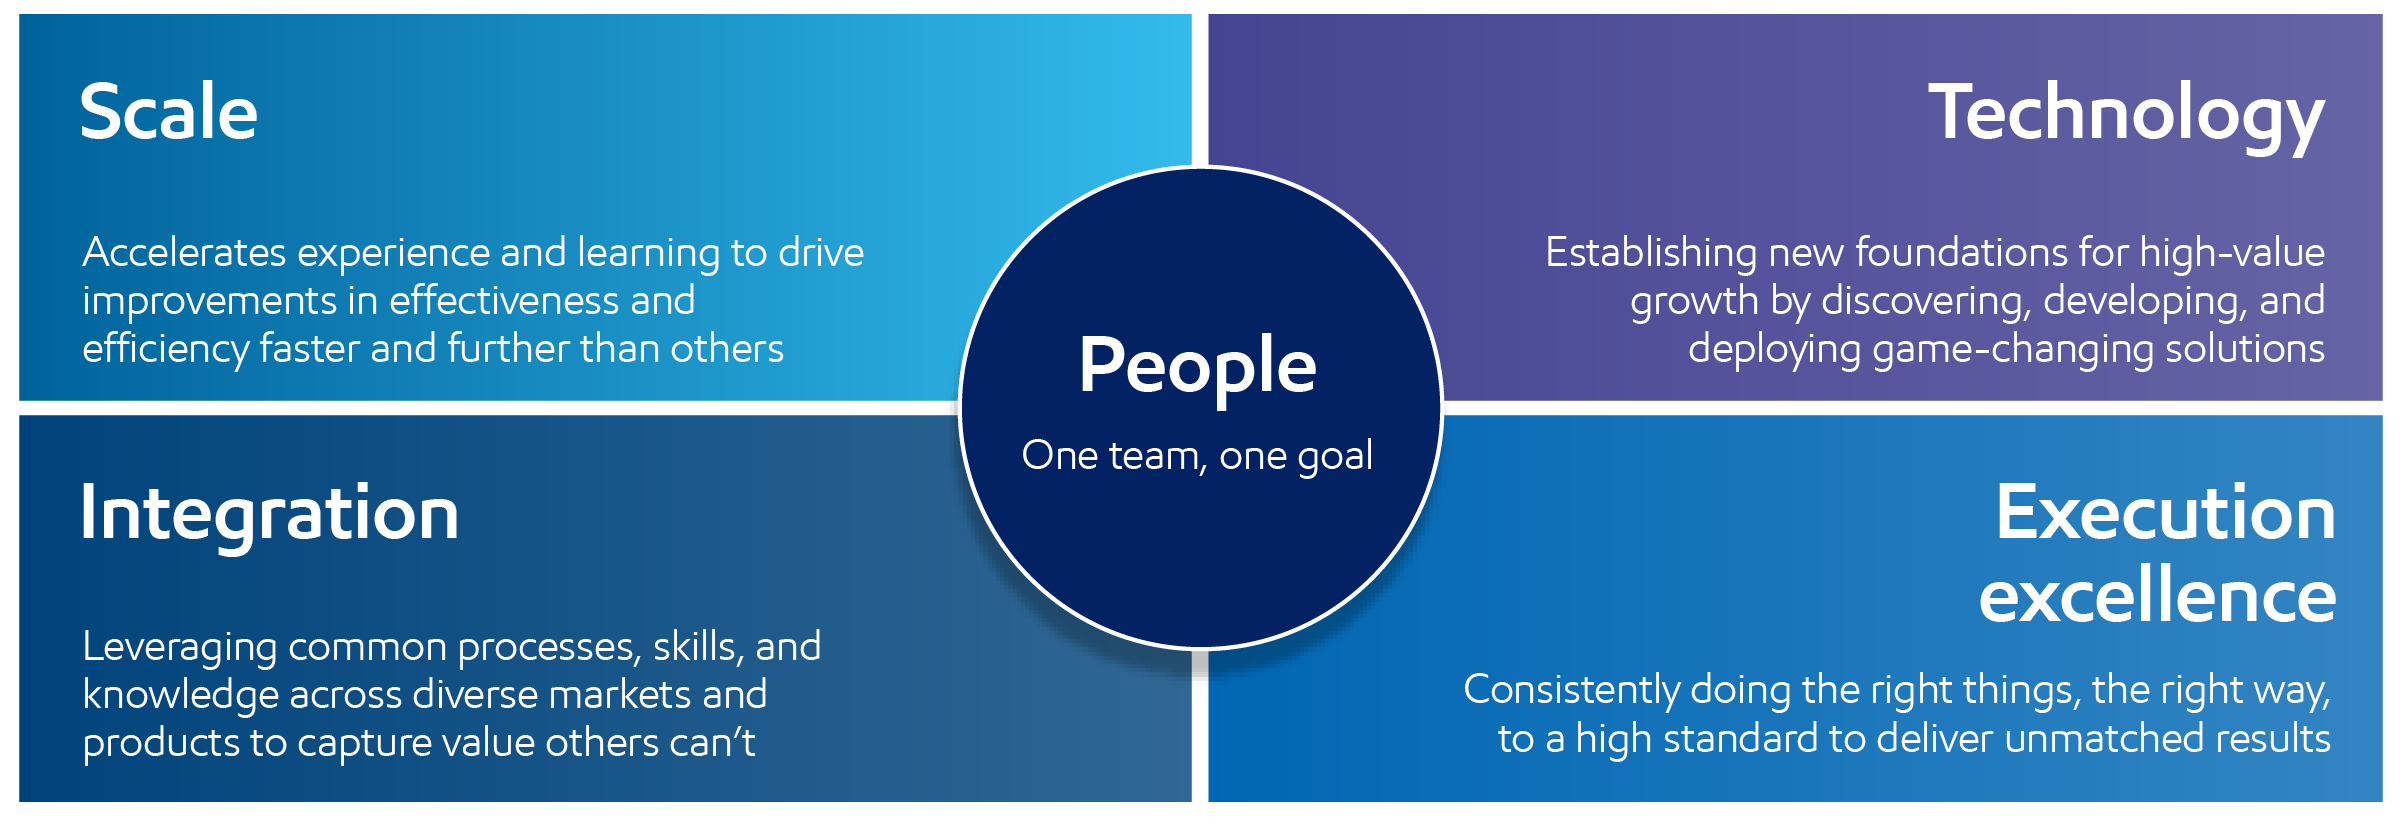
We’ve built our competitive advantages over decades, and we’ve strengthened our organization in recent years to unlock their full potential – in a way that puts us in a league of our own.
Examples of how we apply technology to transform molecules:
-
Developing new ways to produce hydrogen from natural gas
- We are working with others to accelerate methane pyrolysis – a technology that produces low-emission hydrogen and solid carbon.11
-
Liquifying gas to economically transport it around the world to power homes and industries
- Liquefied natural gas can eliminate up to 60% of GHG emissions when it replaces coal to generate electricity.12
-
Upgrading low-value molecules into valuable products that reduce GHG emissions
- ProxximaTM resin systems have less than half the GHG emissions than many traditional thermoset resins on a cradle-to-gate basis.13
-
Producing polymers that make modern life possible with fewer life-cycle GHG emissions than many alternatives
- As studied, polyethylene packaging typically has half the GHG emissions of metal, glass, and paper alternatives, based on peer-reviewed life-cycle assessments in the U.S. and Europe.14
Policy and market development set the pace –
Our capabilities set the bar
Our unique slate of lower-emission opportunities leverages our core strengths in technology, molecular transformation, and large-scale manufacturing.
Carbon capture and storage is an area where our investment has been accelerating. And we estimate our U.S. Gulf Coast CCS network will have the capacity to ultimately remove up to 100 million metric tons per year of captured CO2 once optimized and fully developed.16
Per the U.S. EPA, that’s equal to the CO2 emissions from the electricity used in a year by more than 20 million homes – that’s nearly as many as homes as Texas and New York combined.17
Lowering GHG emissions worldwide requires all technologies to be in the mix.
Here’s what we’re working on today:
- ProxximaTM resin systems: We’re transforming low-value molecules into a high-value resin that can be used to create products that replace steel in many applications – with more durability, corrosion resistance, lighter weight, and lower GHG emissions.18
- Hydrogen: We continue to advance technologies to help expand the uses and sources of hydrogen, encouraging markets to grow. This includes using methane pyrolysis to produce hydrogen and a next-generation hydrogen burner to help decarbonize the chemical industry.19 We have paused our Baytown Low Carbon Hydrogen project until market demand develops.
- Liquefied natural gas (LNG): We expect to have 40 million metric tons of LNG sales per year by 2030, and we have large-scale projects in the U.S., Papua New Guinea, Mozambique, and Qatar.20
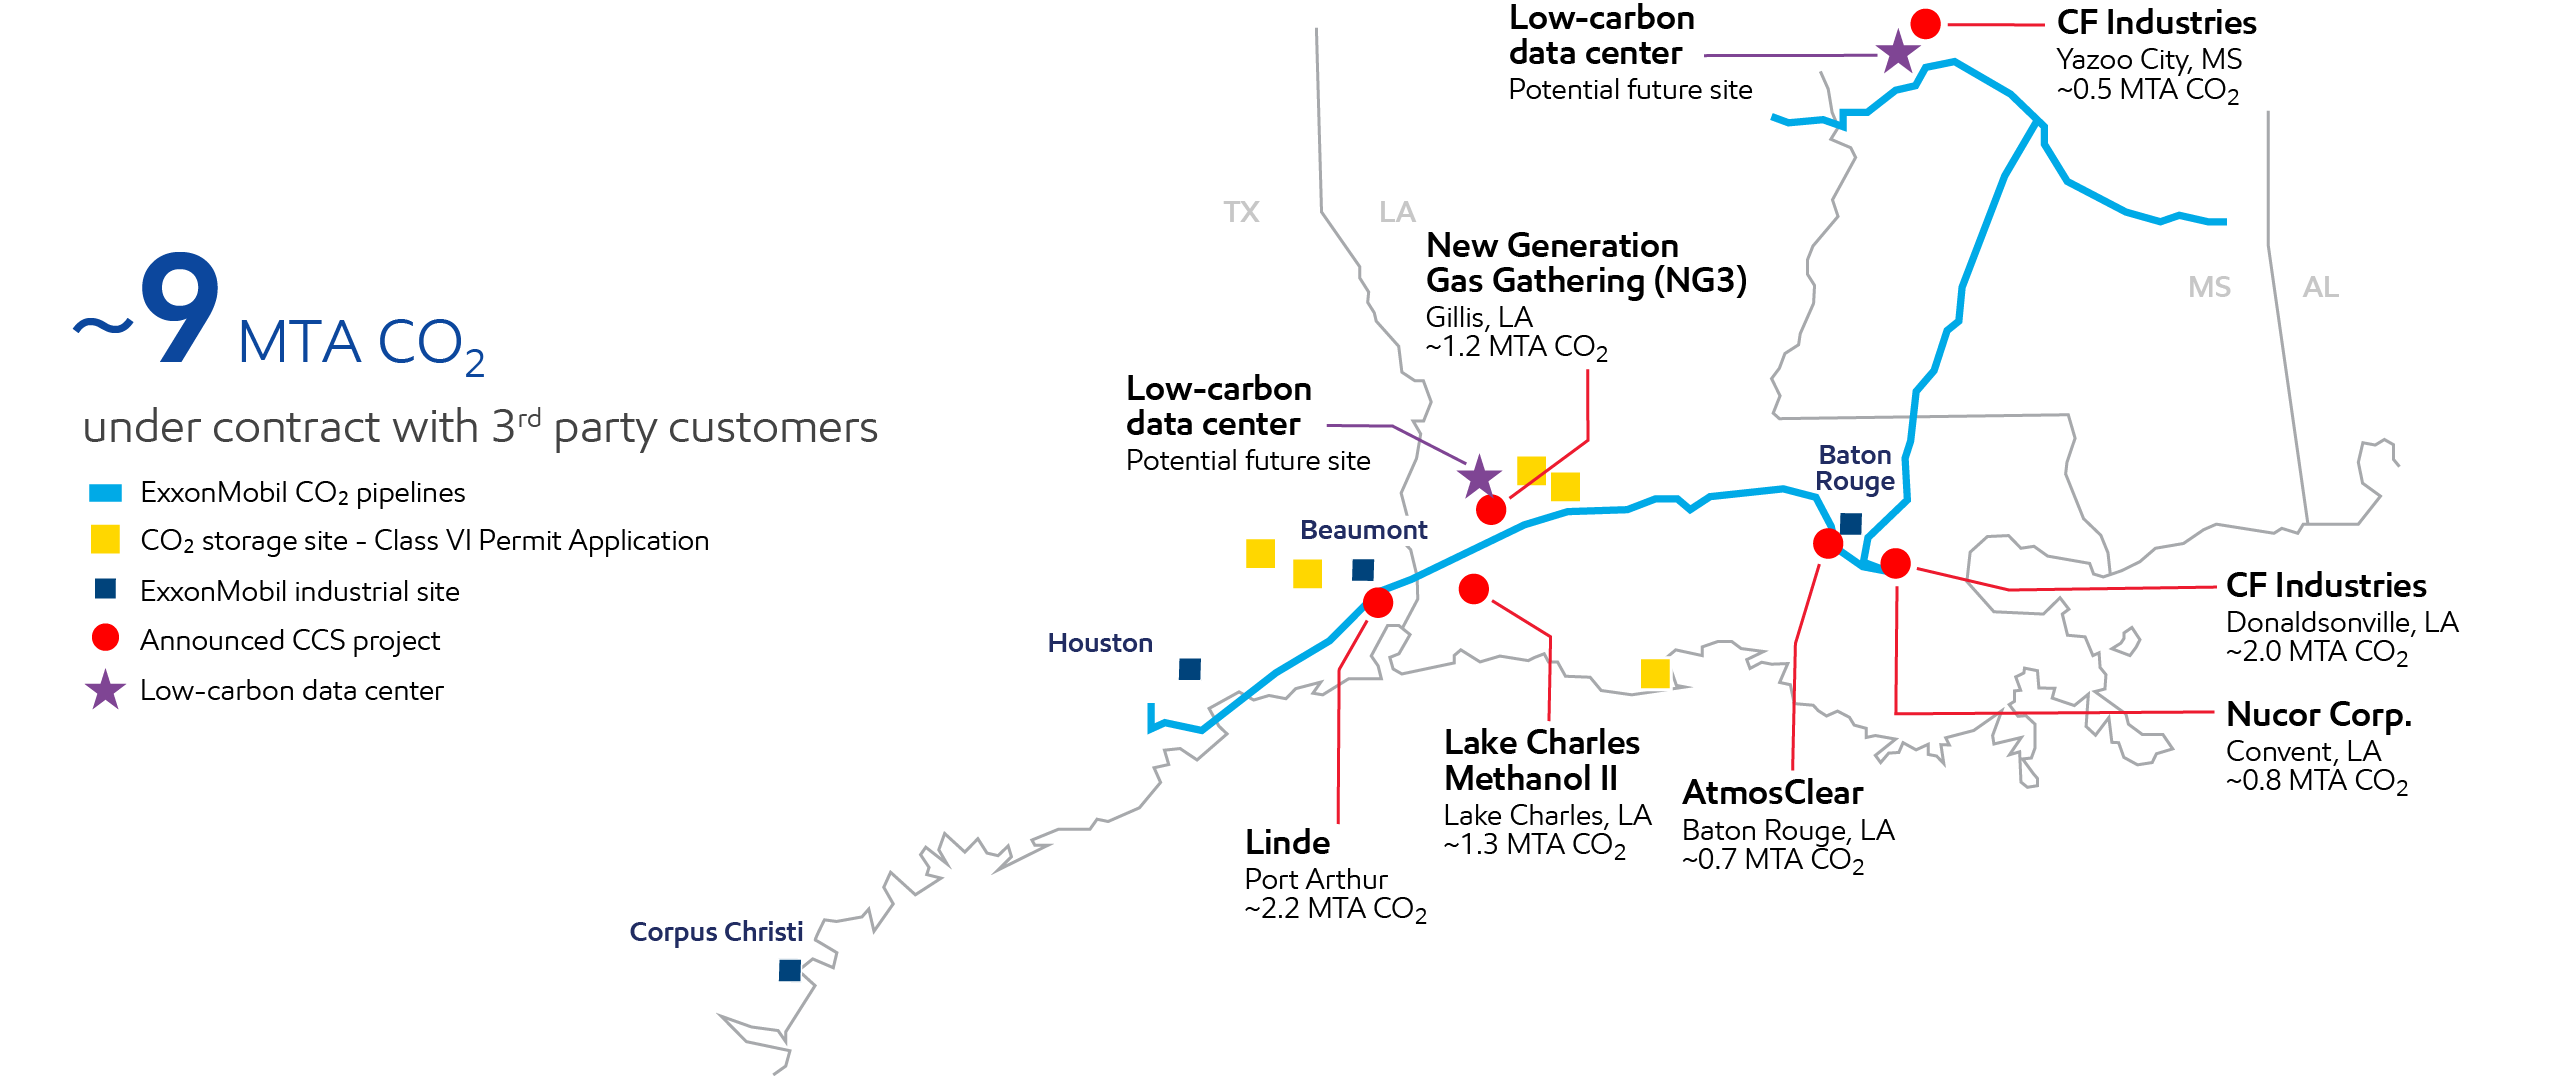
- Carbon capture and storage (CCS): We have agreements with major industrial customers to transport and store up to ~9 million metric tons of direct CO2 emissions per year.21 Two projects are now transporting and storing CO2 – one with CF Industries, and one with New Generation Gas Gathering.
- Advanced graphite: We’re expanding into the advanced synthetic graphite business with our acquisition of Superior Graphite’s U.S. assets and advantaged graphitization technology. Our next-gen battery anode graphite is engineered to deliver 30% faster charging, up to 30% higher usable battery capacity, and up to 4x longer life than traditional graphite materials.22
- Lithium: We’re working to become a substantial lithium supplier by producing U.S.-based, low-cost lithium using a process that has far less environmental impact than traditional hard rock mining.23
- Biofuels: Our Canadian affiliate Imperial Oil is now supplying customers with renewable diesel from its Strathcona refinery. The facility has the capacity to produce up to 20,000 barrels a day of lower GHG emission fuels – more than any other facility in Canada.24
- Low-carbon data centers (LCDC): We’re working on potential LCDC projects in Louisiana and Mississippi. By combining our unmatched CCS asset base with our unique industrial-scale projects capabilities and expertise, we can provide hyperscalers reliable low-carbon power.
Advantaged U.S. Gulf Coast position25
Our plans and progress –
2030 GHG emission-reduction plans and 2050 net-zero ambition
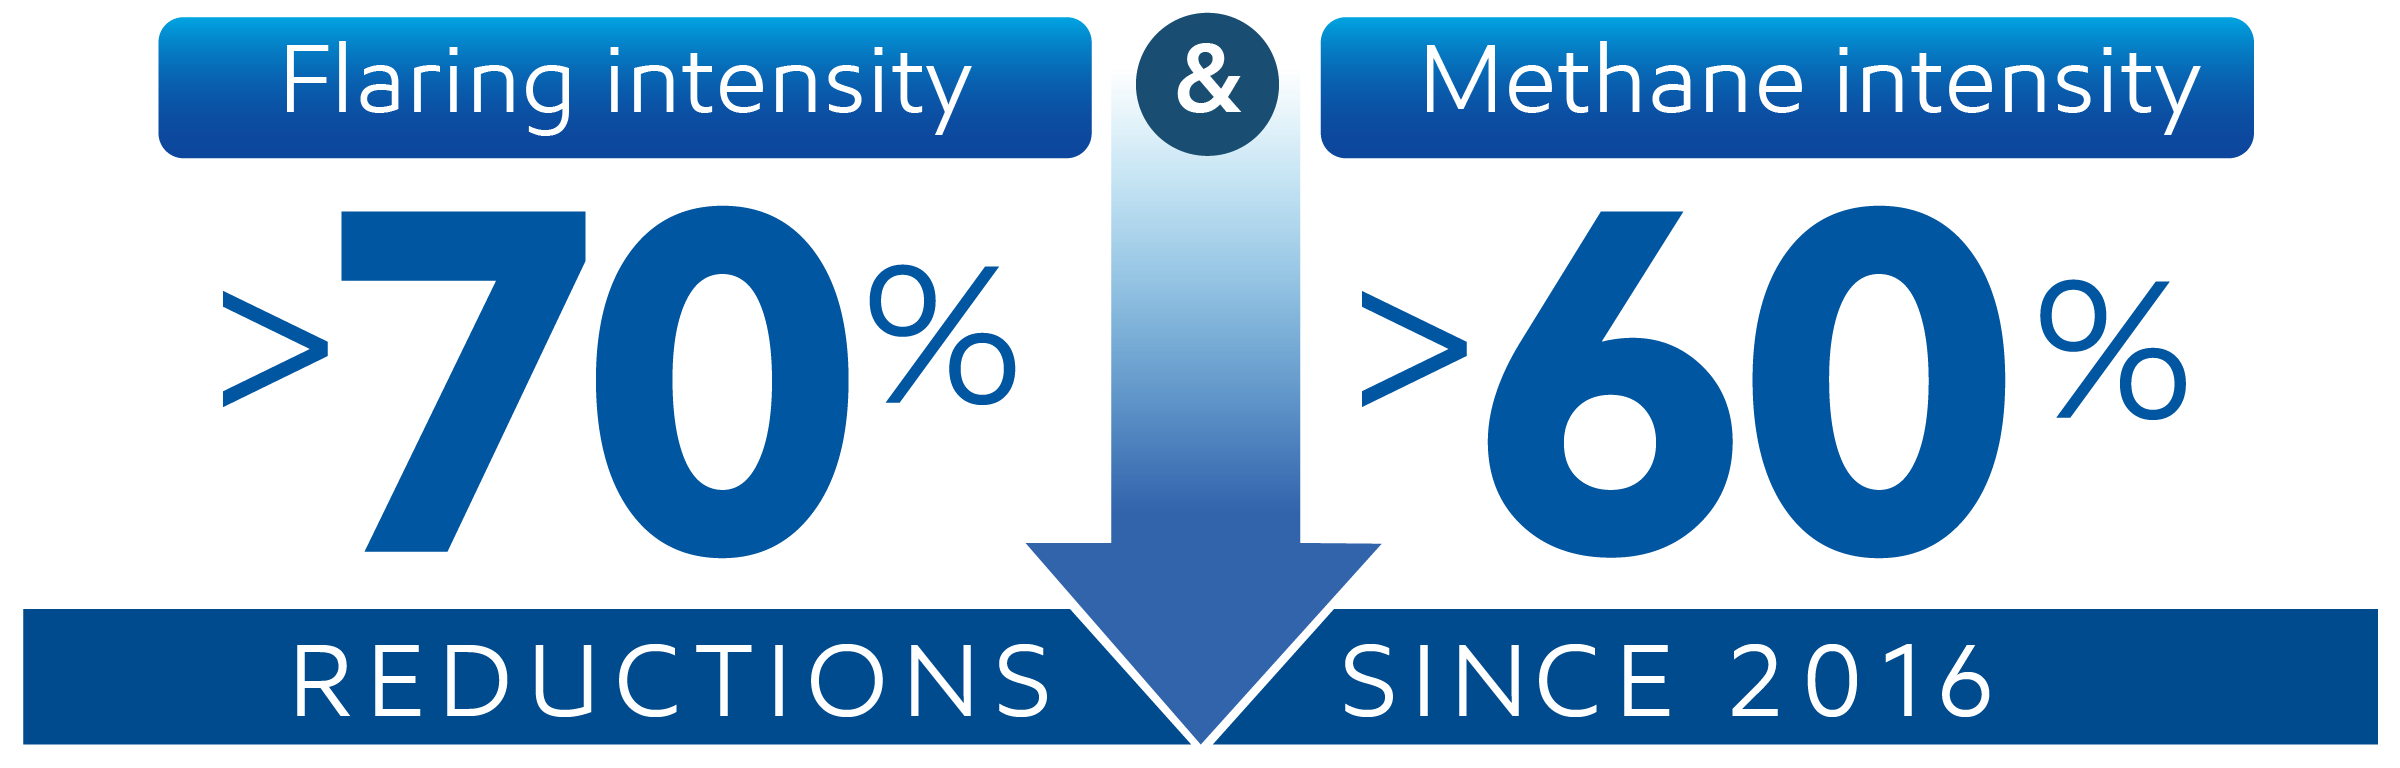
Since 2016, we’ve reduced our operated GHG emissions intensity by more than 20%, driven by methane and flaring reductions, and improved energy efficiency.
>20% reduction in corporate-wide GHG emissions intensity26
Operated Basis
(T CO2e/100 T)
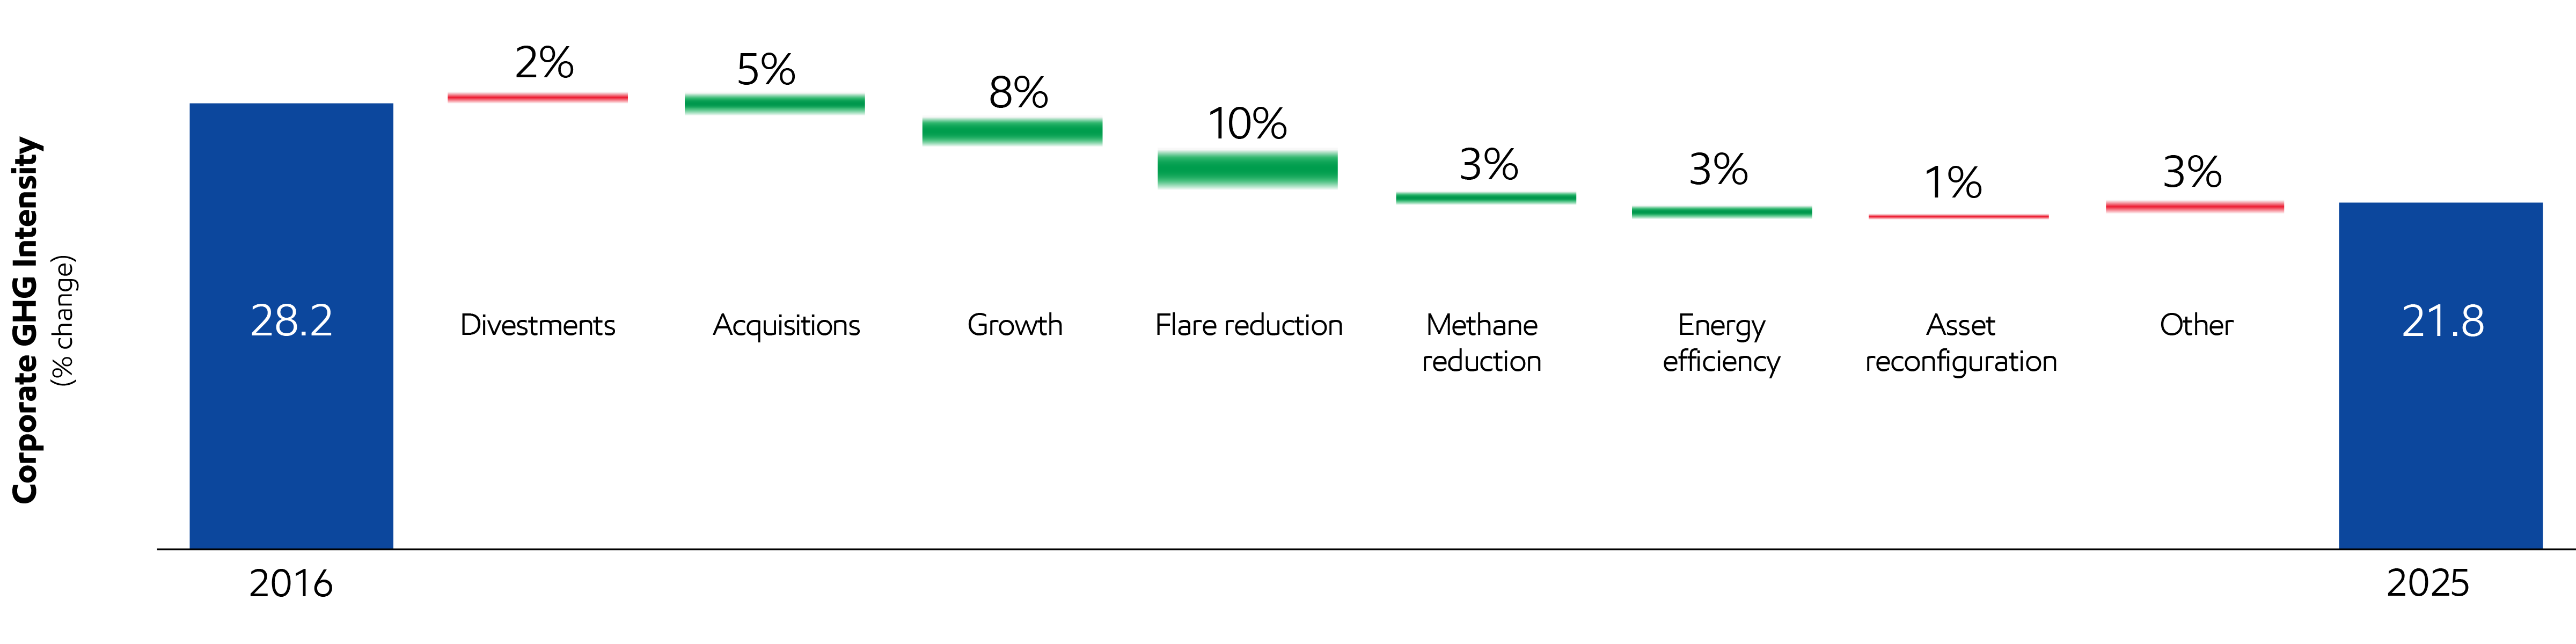
"Other" includes power-purchase agreements, energy attribute certificates, and other changes.
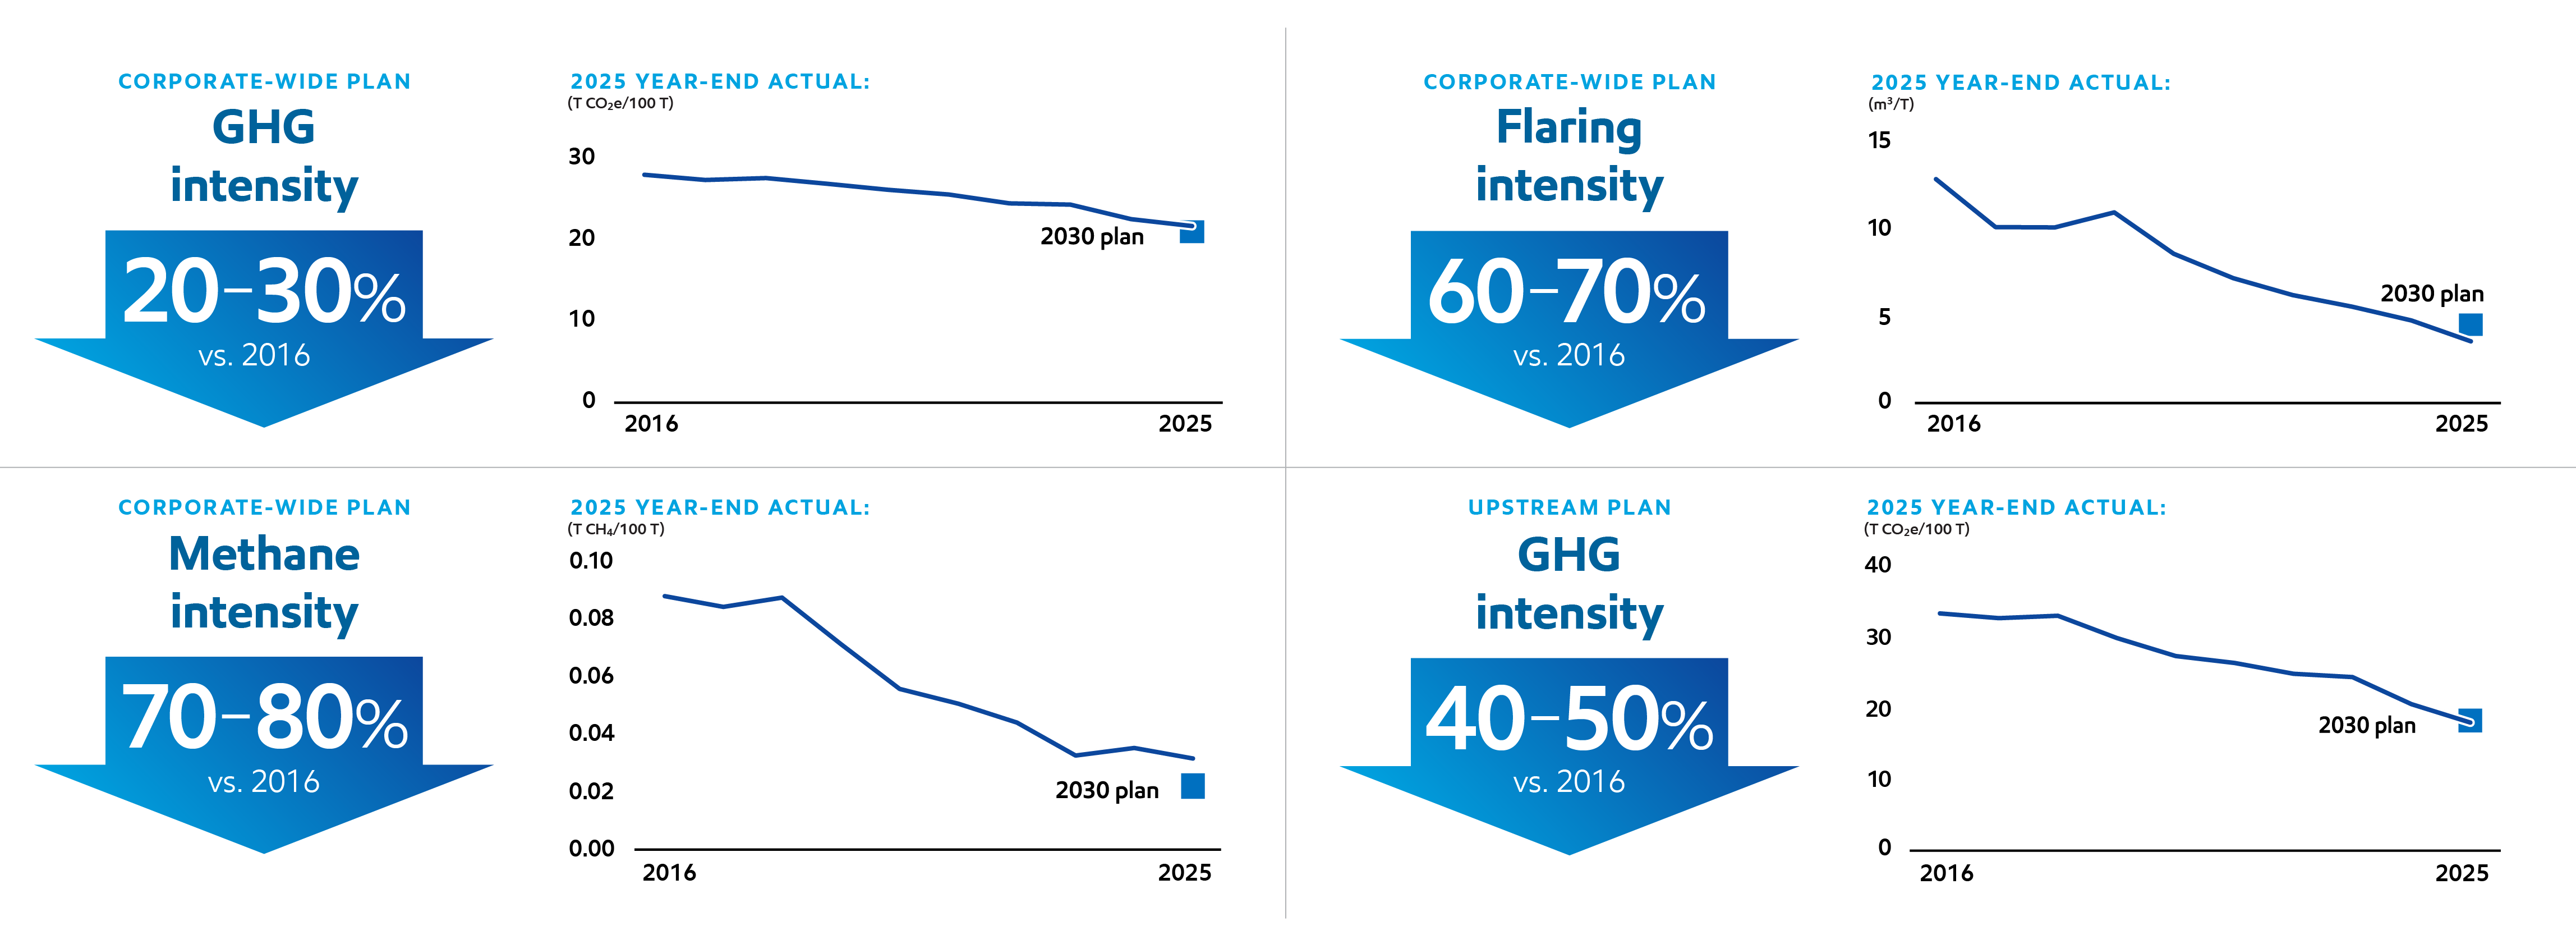
Our 2030 plans drive further reductions vs. 2016 – and we’re beating them27
Applies to annual Scope 1 and 2 GHG emissions from operated assets.
Status of our 2050 net-zero ambition
A few years ago, we announced a 2050 net-zero GHG ambition for our operated assets.28 We’ve consistently noted that reaching net zero in that timeframe would require new advancements in technology, the implementation of practical government policies, and the formation of market-driven mechanisms.
None of those developments have materialized yet at the level necessary to support achieving net zero by 205029 – for society or ExxonMobil. Some governments are enacting policies that are pushing a narrow set of solutions, making energy and products less accessible and less affordable. These policies also, regrettably, make emissions reductions harder and more costly.
For our part, we’re focusing on the things we can control. We’re beating our 2030 emission-reduction plans across our portfolio. We’ve already achieved GHG and flaring intensity reductions that put us in our plan range, and we expect to do the same for methane intensity in 2026.30
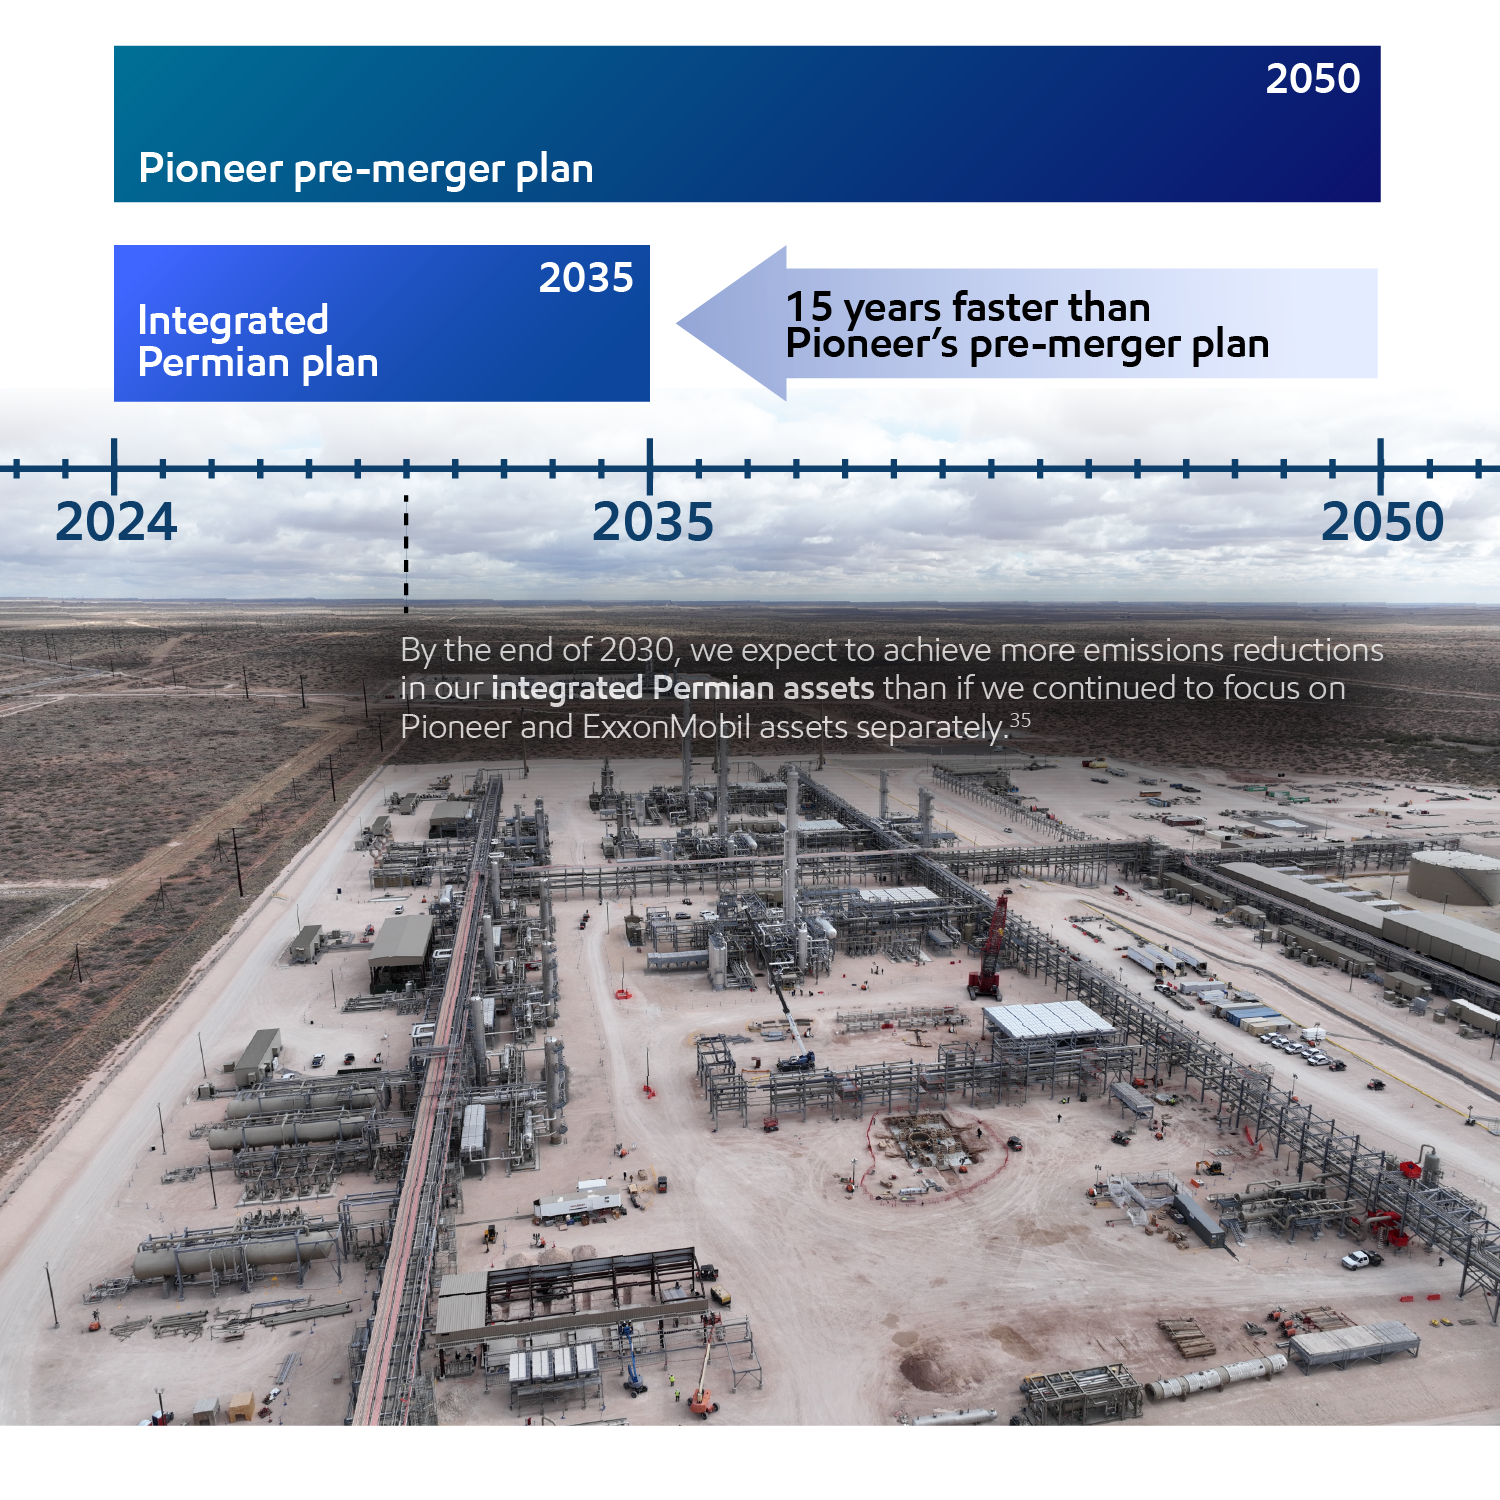
Following the merger with Pioneer Natural Resources, we’re operating as a single entity across the Permian Basin. By 2030, we plan to reduce emissions in our combined Permian operations by more than the equivalent of achieving net zero in our heritage ExxonMobil assets. We’re on track to achieve net zero across all our Permian operations by 2035, including our Pioneer assets.
The Intergovernmental Panel on Climate Change projects a wide range of timing for global net zero across its scenarios, and the International Energy Agency now says that 1.5°C of warming is inevitable in all its scenarios.31
Our plans and progress –
Building a business for the long term
Informed by our Global Outlook, we update our business plans to advance our 2030 GHG emission-intensity reduction plans every year. We have achieved our plan objective for three of the four emission-intensity reductions early, but there’s still progress to be made.
The roadmap below illustrates a potential pathway for us to achieve the upper end of our emission-intensity reduction plans, an update to past years’ roadmap illustrations.
Abatement options for operated assets to advance 2030 Scope 1 & 2 emission-intensity reduction plans32
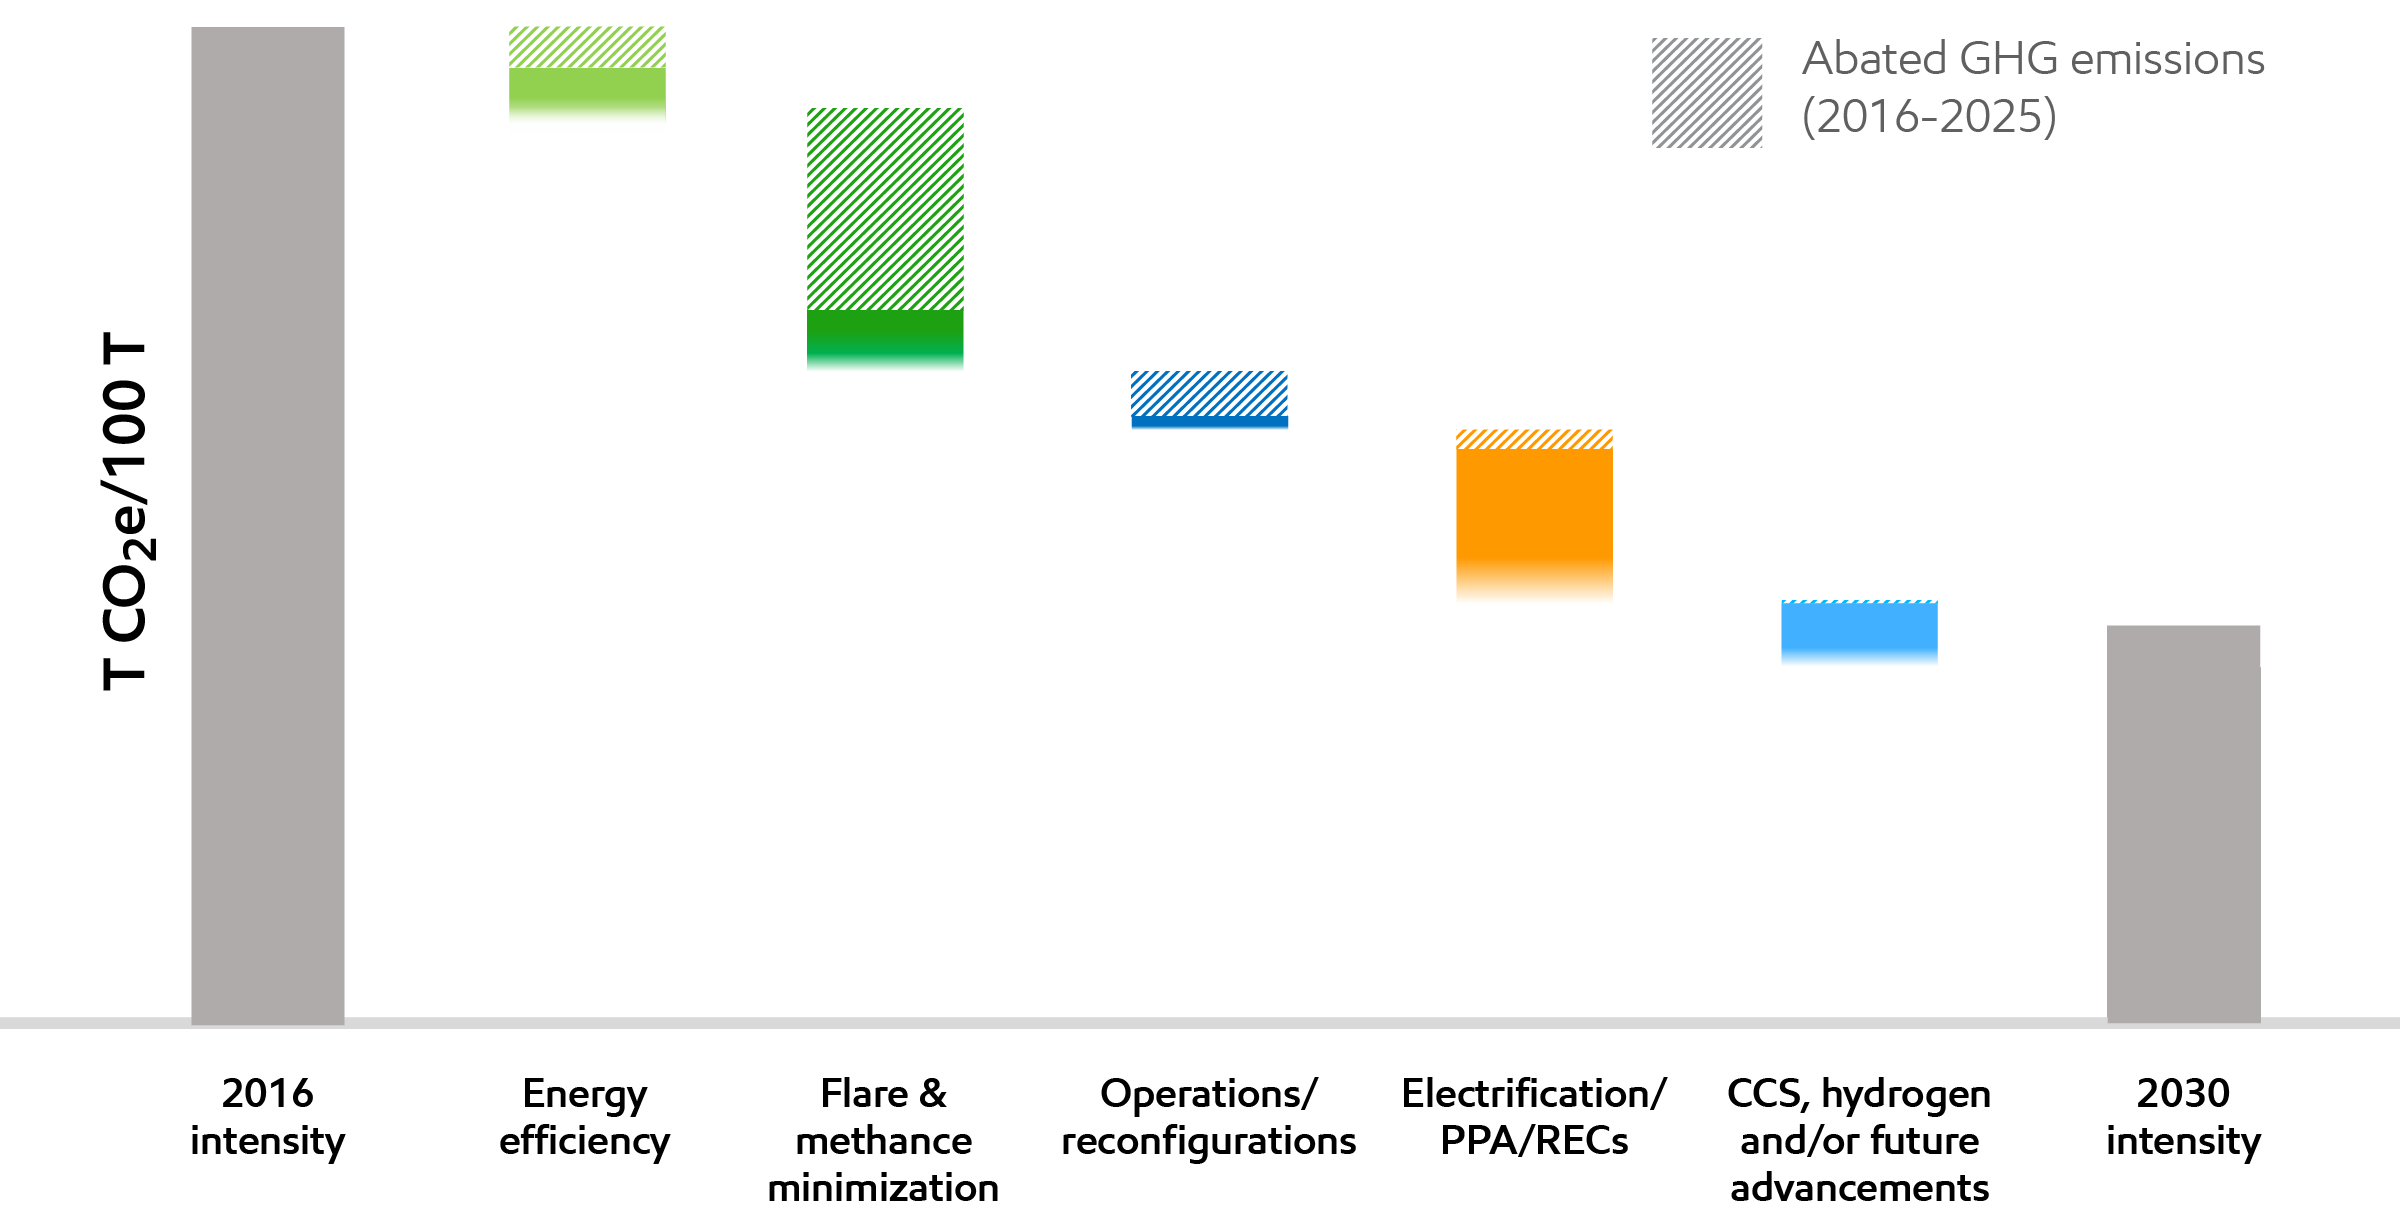
Our plans to reduce GHG emission intensity through 2030 include:
- Advancing technologies, including innovative methods to detect and further reduce methane emissions – monitored through a centralized response hub in real time.
- Eliminating routine flaring in our upstream operations in line with the World Bank's Zero Routine Flaring by 2030 Initiative.33
- Deploying carbon capture and storage and lower-emission fuels in our operations.
- Electrification of equipment and integration of lower-emission technologies.
- Removing GHG emissions sources like pneumatic devices.
- Improving energy efficiency in our businesses by evolving operational, maintenance, and design processes.
Well-positioned for a lower-emission future
No single transition pathway can be reasonably predicted. There is still a wide range of uncertainties. Our company is positioned to grow across a range of potential energy transition paths, including lower- and higher-demand scenarios.
A key part of ExxonMobil’s purpose is meeting society’s evolving needs – it’s what we’ve done for more than 140 years. We retain the ability and flexibility to reallocate capital across our portfolio – including oil and natural gas, chemicals, carbon capture and storage, lower-emission fuels, and carbon materials – to maximize shareholder value as policy, technology, and markets develop
As we have seen, an energy transition will unfold at an uncertain pace, determined in part by variations in policy by region and advancements in technology. Our Global Outlook provides our view of how these and other signposts affect supply and demand dynamics around the world.
We’re on track to achieve Scope 1 & 2 net zero in our full Permian Basin operations by 203534,35
Our plans and progress –
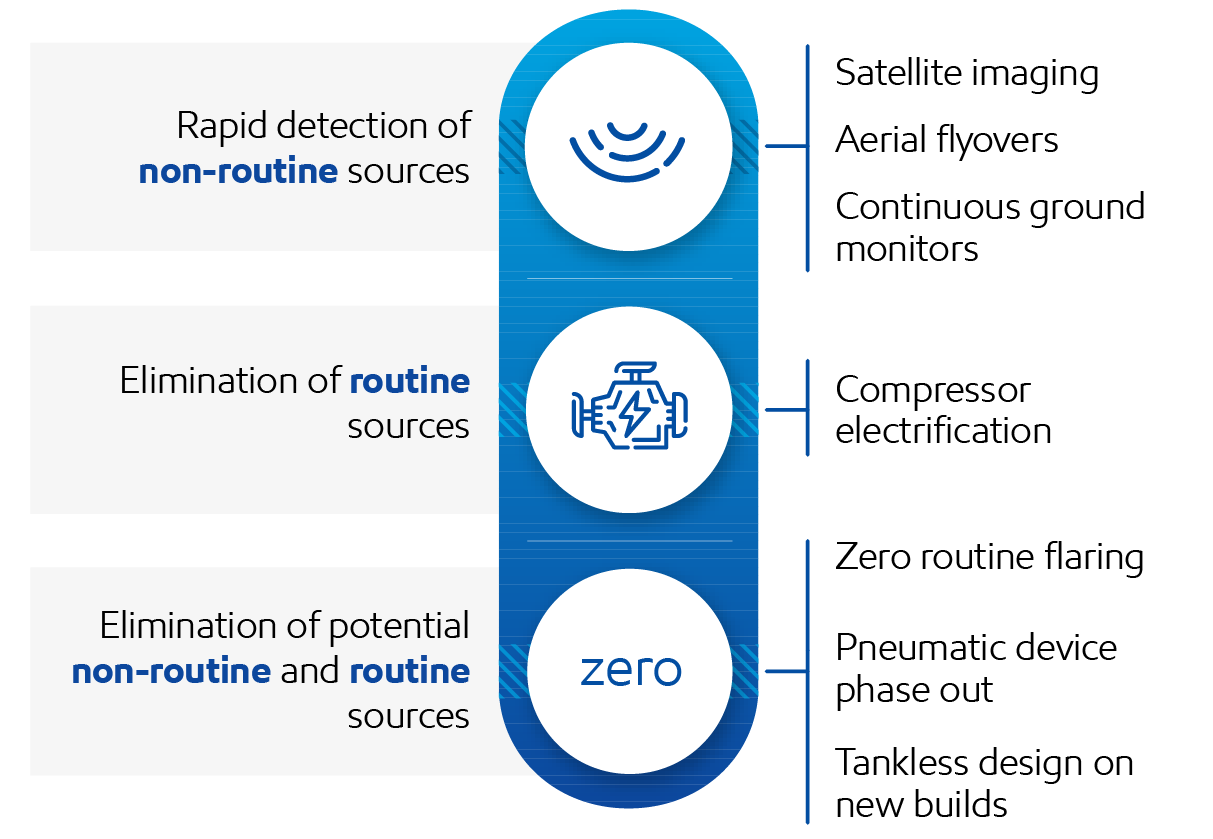
Managing and mitigating methane emissions
Natural gas is:
- Easy to transport – especially as global LNG trade expands.
- Abundant and flexible – with growing demand in places like India, where compressed natural gas is taking off in transport.
- Reliable and less GHG intensive – reducing CO2 emissions by up to 60% when replacing coal to make electricity.36
But to get the most out of those benefits, methane has to stay in the system - not just because it’s a much more potent greenhouse gas than CO2, but because keeping it in the pipe means more product available to customers.
And we’re making good progress. Methane and flaring reductions made up the bulk of our company's >20% GHG emissions-intensity reductions since 2016.
We continue to scale technologies that help us find and fix leaks faster. In October, we unveiled Vantage – our state-of-the-art, centralized operations hub giving teams a real‑time view of events on the ground across thousands of sites, allowing us to identify and respond to operational events quickly.ExxonMobil’s focus on methane emissions – from ground, air, and space
Our Global Outlook forecasts that natural gas will be nearly 25% of the primary energy mix in 2050
2025 Global Outlook
Our key collaborations:
U.N. Oil & Gas Methane Partnership 2.0
- Participating companies detect, quantify, verify, and report on methane emissions.
- ExxonMobil received Gold Standard Pathway recognition for our plan to achieve the highest level of emissions reporting under the U.N.’s program.
Oil and Gas Climate Initiative (OGCI)
- A CEO-led initiative of 12 of the world’s leading energy companies.
- ExxonMobil played a leading role in developing OGCI’s Satellite Monitoring Campaign and the Satellite Methane Detection Response Playbook.
Oil & Gas Decarbonization Charter
- Member companies working toward greenhouse gas reductions, including near-zero upstream methane emissions by 2030 and zero routine flaring by 2030.
- The initiative aims to expand participation, geographic coverage, and impact.
Rational and constructive policy –
Key to meeting demand for energy products and reducing carbon emissions
You can’t manage what you can’t measure.
Policy can, and must, work hand-in-hand with technology to accelerate the pathways to a lower-emission future. To help solve the “and” equation, there must be clear market incentives to reduce emissions and a way for innovative companies to compete for the most effective solutions.
A direct carbon emissions accounting framework is needed.
To track carbon emissions as they move through the economy, we need an accurate system that is consistent and transparent. And it must be grounded in principles from both financial accounting and basic science.
|
Accounting |
Chemistry and engineering |
|
|
Recording emissions from each product and service only once in a uniform and verifiable way that is familiar to businesses. |
Understanding how and when CO2 emissions are created, reduced, or emitted is key to understanding the challenge. |
A consistent carbon emissions accounting framework would empower the market to identify and support the most effective solutions for reducing emissions while still meeting demand for energy and products.
With robust data at the product level, markets and regulators can reward lower-carbon production, spur competition, and accelerate innovation.
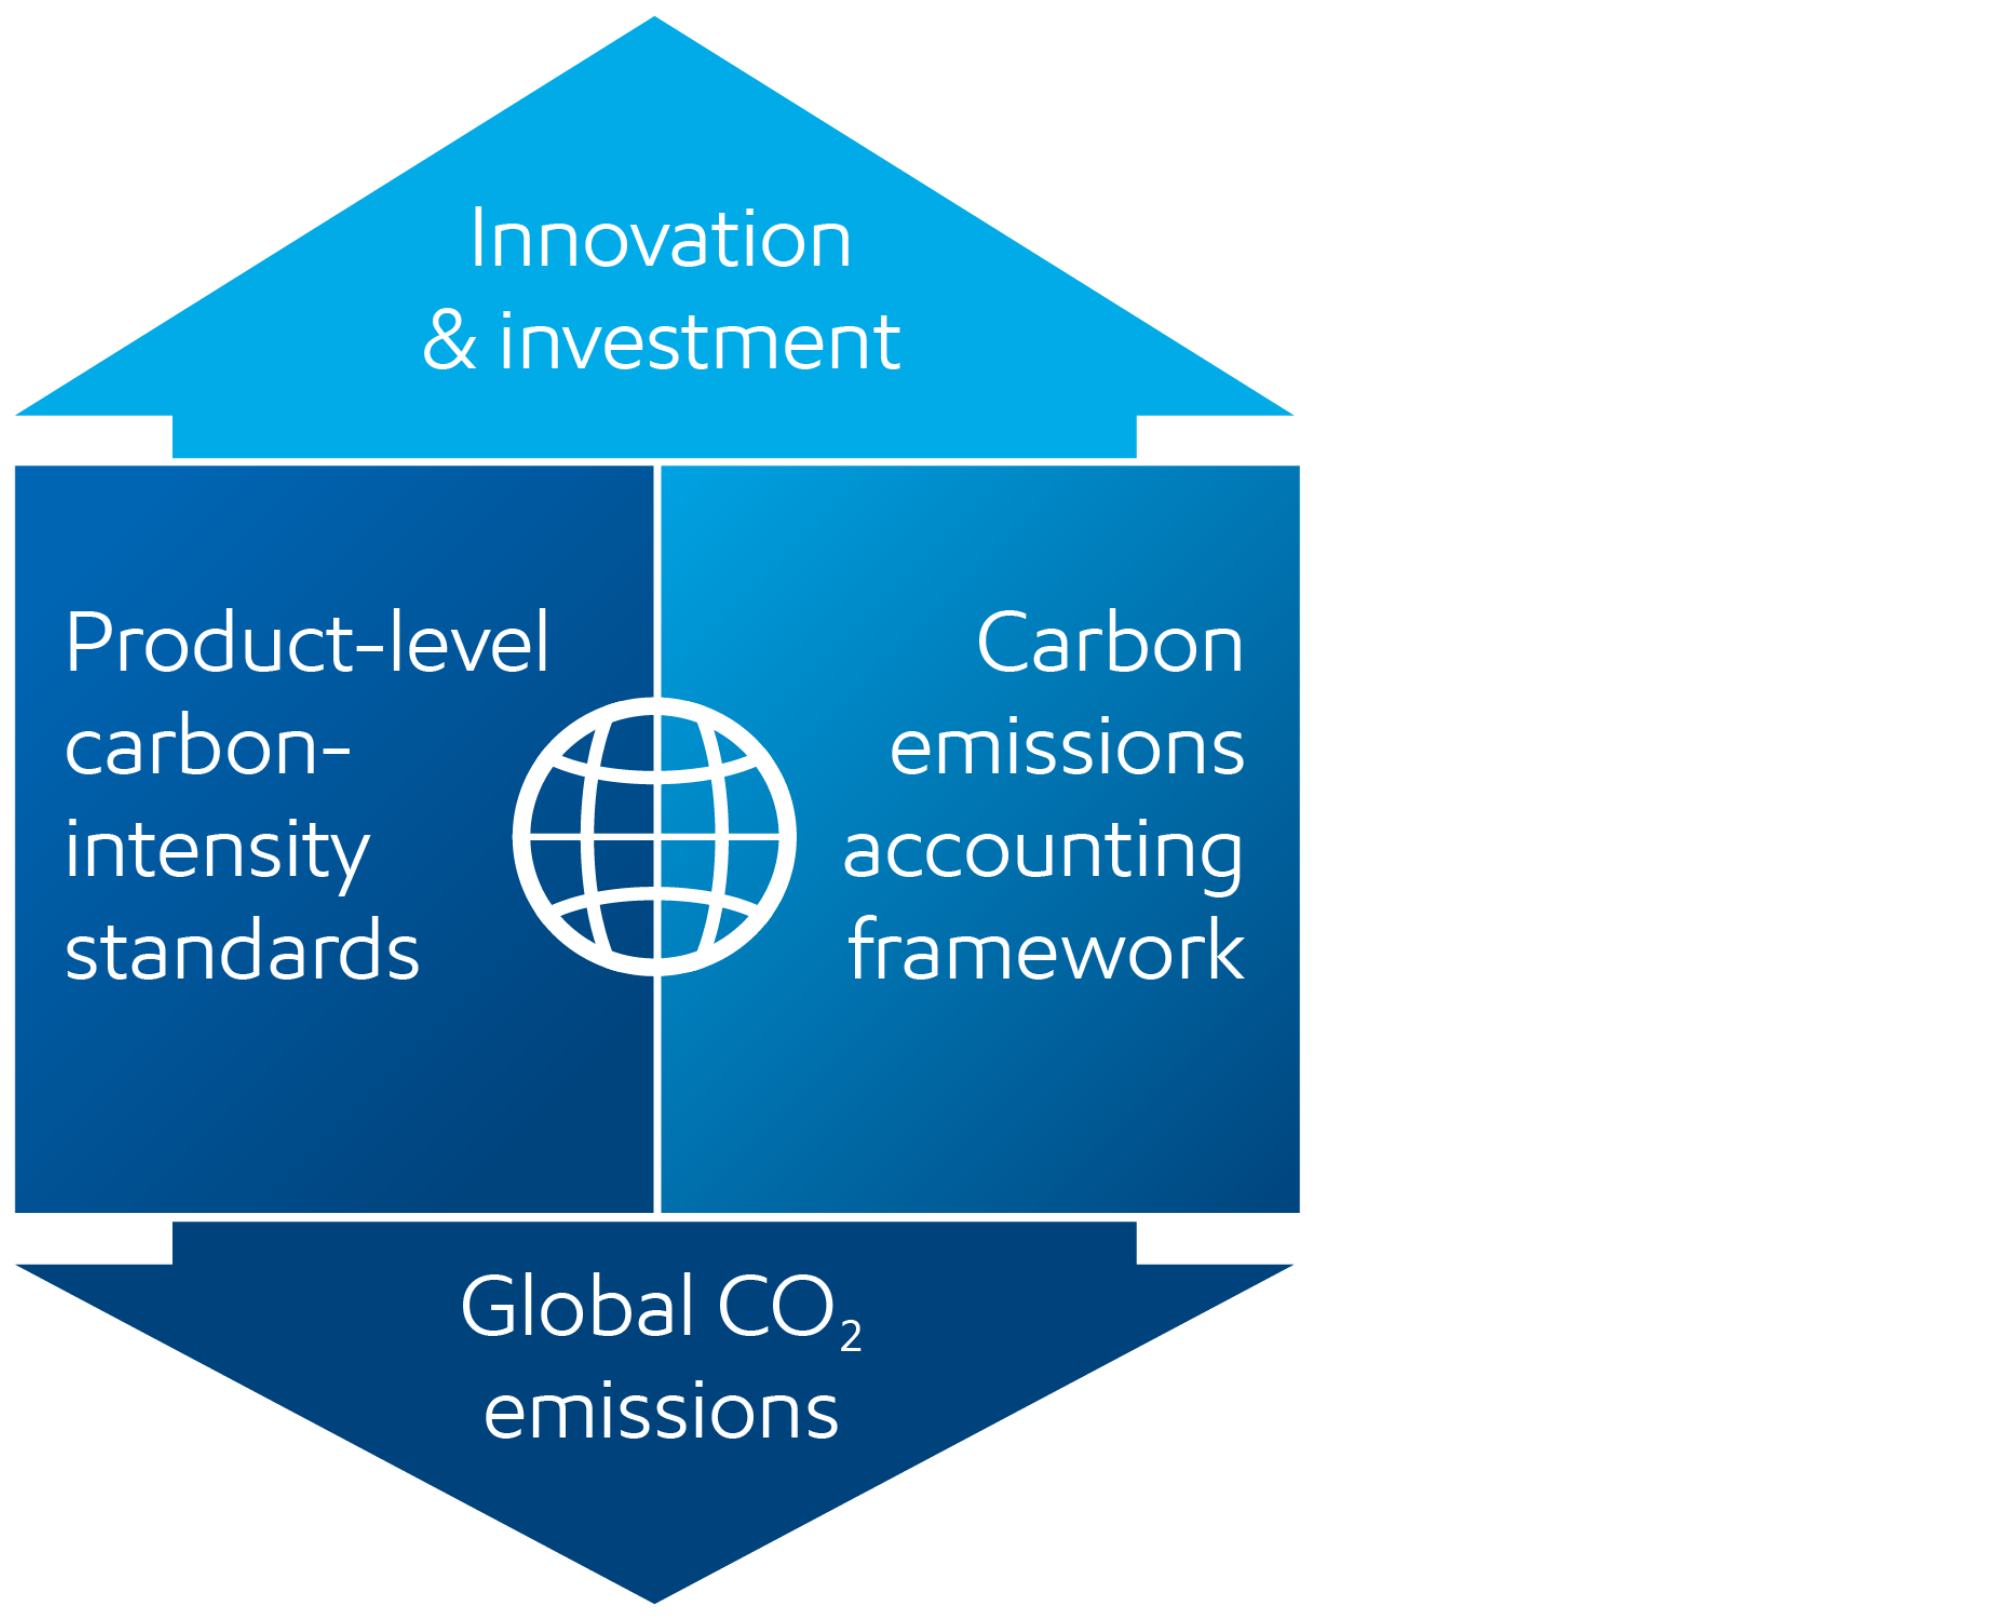
It’s time for a pragmatic approach using product-level carbon-intensity standards.
Rational and constructive policies engage industry participants and competitive markets to drive the best ways to reduce emissions at the lowest cost.
Product-level carbon-intensity standards backed by regulation would do just that. Standards like these are proven. They’re adjustable. And they drive effective solutions.
That’s how society can bend the curve on emissions while meeting people’s needs.
“To achieve a lower-emission future, government GHG policy should set carbon-intensity standards on products. We believe this is the best way to engage the collective efforts of industry and leverage competitive market forces. To drive further innovation and reduce the most emissions at the lowest cost, policies must remain technology agnostic. Governments should not pick winners and losers. Intensity standards establish a level playing field and have a strong precedent."
Putting our values to work –
Our focus on doing the right thing, the right way
The 14 Sustainability Focus Areas in our Sustainability Report are those topics that we believe are most relevant to our company and important to society. We develop strategies, allocate resources, and execute plans to address risks and opportunities within each of them.
Meeting society’s needs requires a long-term outlook and large-scale solutions. It takes a consistent focus on doing the right thing, the right way. And it takes collaboration – with everyone engaged in our business:
-
Communities
Be a trusted partner that creates high-quality jobs, operates safely with care for the environment, and invests to address socioeconomic challenges. -
Employees
Provide unrivalled opportunities for personal and professional growth, with safe, impactful work for an entire career. -
Customers
Meet their needs for affordable, reliable energy and products with lower GHG emissions intensity. -
Investors
Deliver industry-leading returns on the capital entrusted to us – today, tomorrow, and far into the future.
We hold our people to the highest ethical standards and expect them to do what’s right.
ExxonMobil's Core Values

Putting our values to work –
Our approach to sustainability in our operations
The answers are as complex as our portfolio, and they will change over time. How we act on what we learn will ultimately help us capture the full value of our competitive advantages – in the right way.
Protect Tomorrow. Today. is the guiding principle behind our approach to sustainability in our operations.
In our Sustainability Report, we describe how it inspires us to look at what we do with the mindset to be the most responsible operator in our industry.
We encourage our leaders and teams to ask questions that go beyond “what are we required to do?” We are asking proactive questions like:
- How can we reduce or mitigate emissions, waste, or the resources we use in our operations?
- How can we increase benefits for our communities and reduce operational impacts?
- How can we collaborate on industry standards and regulations to improve outcomes?
“We have a philosophy to be the most responsible operator in our industry. For as long as there’s a demand for oil and gas, you want the most responsible companies producing that.”
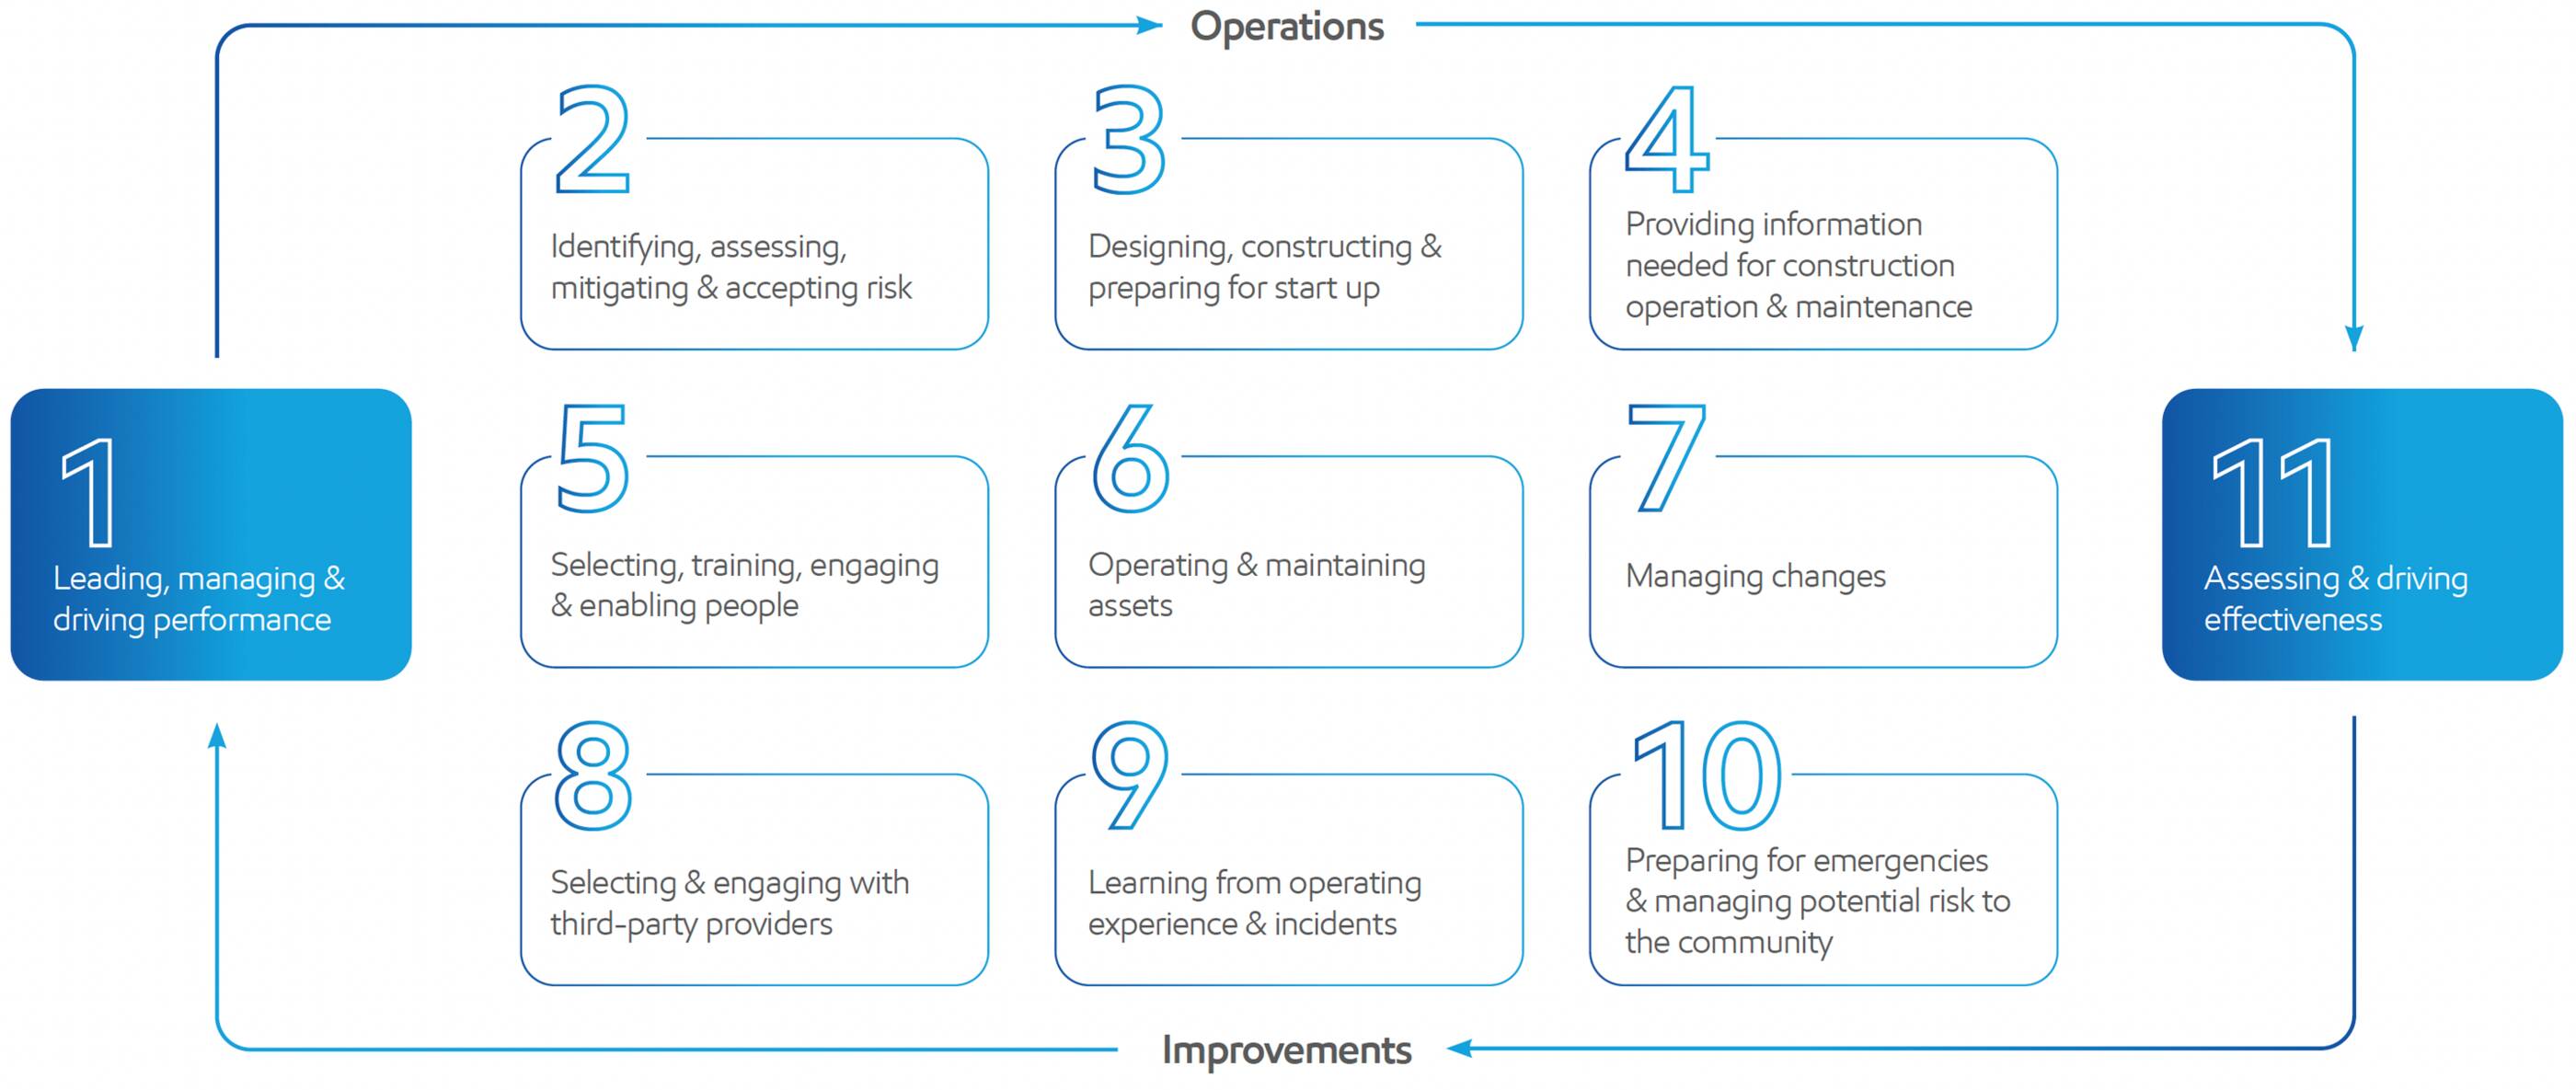
Our Operations Integrity Management System (OIMS) provides a framework to help make it happen. It sets clear expectations supported by processes that help us manage risks everywhere we work – from remote environments to vibrant communities.
Publications
Explore more
Content index
Data
•
6 min read
• May 21, 2026
Enhancing process safety
Report
•
3 min read
• May 5, 2026
Leading in personnel safety
Report
•
3 min read
• May 5, 2026About our Advancing Climate Solutions and Sustainability Reports and Cautionary Statement
Report
•
4 min read
• May 5, 2026
Improving air quality
Report
•
2 min read
• May 5, 2026
Integrating sustainability into what we do
Report
•
8 min read
• May 5, 2026
FOOTNOTES:
- ExxonMobil 2025 Global Outlook (Aug. 28, 2025) projections.
- Tracking SDG7: The Energy Progress Report 2025, page 3: https://iea.blob.core.windows.net/assets/fc78dc81-8167-4c41-b8a6-e3386fecf957/TrackingSDG7TheEnergyProgressReport%2C2025.pdf IEA, IRENA, UNSD, World Bank, WHO. 2025. Tracking SDG 7: The Energy Progress Report. World Bank, Washington DC. © World Bank. License: Creative Commons Attribution—NonCommercial 3.0 IGO (CC BY-NC 3.0 IGO)
- IEA (2025), World Energy Outlook 2025, IEA, Paris https://www.iea.org/reports/world-energy-outlook-2025, Licence: CC BY 4.0 (report); CC BY NC SA 4.0 (Annex A); IPCC: AR6 Scenarios Database hosted by International Institute for Applied Systems Analysis (IIASA) release 1.0 average. IPCC C3: "Likely Below 2°C" scenarios.
- Lower emissions cash capex includes cash capex attributable to carbon capture and storage, hydrogen, lithium, biofuels, ProxximaTM systems, carbon materials, and activities to lower ExxonMobil’s emissions and/or third party (3P) emissions.
- Based on Scope 1 and Scope 2 emissions from operated assets. Intensity is calculated as emissions per metric ton of throughput/production. ExxonMobil reported emissions, reductions, and avoidance performance data are based on a combination of measured and estimated emissions data using reasonable efforts and collection methods. Calculations are based on industry standards and best practices, including guidance from the American Petroleum Institute (API) and Ipieca. There is uncertainty associated with the emissions, reductions, and avoidance performance data due to variation in the processes and operations, the availability of sufficient data, quality of those data, and methodology used for measurement and estimation. Performance data may include rounding. Changes to the performance data may be reported as part of the Company’s annual publications as new or updated data and/or emission methodologies become available. We are working to continuously improve our performance and methods to detect, measure and address greenhouse gas emissions. ExxonMobil works with industry, including API and Ipieca, to improve emission factors and methodologies, including measurements and estimates.
- ExxonMobil 2025 Global Outlook (Aug. 28, 2025)
- Ibid.
- Ibid.
- IPCC, 2022: Climate Change 2022: Mitigation of Climate Change. Contribution of Working Group III to the Sixth Assessment Report of the Intergovernmental Panel on Climate Change [P.R. Shukla, J. Skea, R. Slade, A. Al Khourdajie, R. van Diemen, D. McCollum, M. Pathak, S. Some, P. Vyas, R. Fradera, M. Belkacemi, A. Hasija, G. Lisboa, S. Luz, J. Malley, (eds.)]. Cambridge University Press, Cambridge, UK and New York, NY, USA. doi: 10.1017/9781009157926.
- “End-to-end CCS system” entails CO2 capture as well as transportation and storage of CO2. Based on contracts to capture and store ~9 MTA CO2, subject to additional investment by ExxonMobil and receipt of government permitting for carbon capture and storage projects.
- ExxonMobil and BASF join forces to advance low-emission hydrogen through methane pyrolysis technology: https://corporate.exxonmobil.com/what-we-do/delivering-industrial-solutions/hydrogen/advancing-low-emission-hydrogen
- Based on ExxonMobil analysis for power plant use including EIA U.S. electricity net generation and resulting CO2 emissions: https://www.eia.gov/tools/faqs/faq.php?id=74&t=11. Reductions may vary based on regional differences and other variables.
- Comparative carbon footprint of product estimate study: ExxonMobil’s ProxximaTM Resin Systems, June 2023, prepared by Sphera Solutions, Inc. for ExxonMobil Technology and Engineering Company. The study was confirmed to be conducted according to and in compliance with ISO 14067:2018 (Greenhouse gases - Carbon footprint of products - Requirements and guidelines for quantification) by an independent third party critical review panel. All resins assessed in this Life Cycle Assessment (LCA) study were of the type used in molding applications. Specifically, the epoxy resin system was of the type used in VARTM wind blade production. The resin systems are representative of formulated resin systems and include any required curing hardeners or catalysts. https://www.proxxima.com/en/what-is-proxxima/sustainability
- New research shows how popular plastic packaging compares to alternative materials: https://corporate.exxonmobil.com/what-we-do/materials-for-modern-living/how-popular-plastic-packaging-compares-to-alternative-materials#HowPEpackagingcompares
- Lower emissions cash capex includes cash capex attributable to carbon capture and storage, hydrogen, lithium, biofuels, ProxximaTM systems, carbon materials, and activities to lower ExxonMobil’s emissions and/or third party (3P) emissions. Source: ExxonMobil 2025 Corporate Plan Update (Dec. 9, 2025)
- Market potential for emission reduction opportunity based on ExxonMobil analysis of CO2 pipeline routes, current and potential capacity, potential emitters in the U.S. Gulf Coast market, and potential infrastructure upgrades. Subject to additional investment by ExxonMobil, customer commitments, supportive policy, and permitting for carbon capture and storage projects.
- U.S. Environmental Protection Agency's greenhouse gas equivalencies calculator: Carbon dioxide or CO₂ equivalent converted to a U.S. home’s electricity use for one year: https://www.epa.gov/energy/greenhouse-gas-equivalencies-calculator
- Source: Carbon Footprint of Product of Reinforcing Bars: Steel and ProxximaTM Resin containing Glass Fiber Reinforced Polymer (GFRP) in Construction Applications, May 2025, prepared by ExxonMobil Technology and Engineering Company. The study was conducted to be in accordance with ISO 14067:2018 (Greenhouse gases – Carbon footprint of products – Requirements and guidelines for quantification). The study was confirmed to be conducted according to and in compliance with ISO 14067:2018 by an independent third party (Sphera Solutions, Inc.) critical review which followed ISO 14071:2024 to support comparative environmental footprint communications as defined in ISO 14026:2018)
- Baytown breakthrough: Our next-generation hydrogen burner can help decarbonize a key industry: https://corporate.exxonmobil.com/what-we-do/delivering-industrial-solutions/hydrogen/baytown-hydrogen-burner-decarbonize-industry
- Papua New Guinea and Mozambique projects are subject to final investment decision.
- “End-to-end CCS system” entails CO2 capture as well as transportation and storage of CO2. Based on contracts to capture and store ~9 MTA CO2, subject to additional investment by ExxonMobil and receipt of government permitting for carbon capture and storage projects.
- Performance data based on ExxonMobil and third-party proprietary internal analysis. For more information, see https://corporate.exxonmobil.com/what-we-do/materials-for-modern-living/advanced-synthetic-graphite
- Expected smaller footprint of lithium mining and expected lower carbon and water impacts: EM analysis of external sources and third-party lifecycle analyses. a) Vulcan Energy, 2022 https://v-er.eu/app/uploads/2023/11/LCA.pdf, Minviro publication. Grant, A., Deak, D., & Pell, R. (2020). b) The CO₂ Impact of the 2020s Battery Quality Lithium Hydroxide Supply Chain-Jade Cove Partners. https://www.jadecove.com/research/liohco2impact. Kelly, J. C., Wang, M., Dai, Q., & Winjobi, O. (2021). c) Energy, greenhouse gas, and water life cycle analysis of lithium carbonate and lithium hydroxide monohydrate from brine and ore resources and their use in lithium ion battery cathodes and lithium ion batteries. Resources, Conservation and Recycling, 174, 105762.
- Optimizing current production based on product demand, compliance requirements, and supplier capabilities for both the renewable feedstock and also the required hydrogen for processing.
- Information shown is approximate (e.g., storage / pipeline location) and has potential to change as projects are developed and implemented. CO2 storage includes Class VI Permit Application and GLO Storage Site Access.
- ExxonMobil’s reported emissions, reductions, and avoidance performance data are based on a combination of measured and estimated emissions data using reasonable efforts and collection methods. Calculations are based on industry standards and best practices, including guidance from the American Petroleum Institute (API) and Ipieca. There is uncertainty associated with the emissions, reductions, and avoidance performance data due to variation in the processes and operations, the availability of sufficient data, quality of those data, and methodology used for measurement and estimation. Performance data may include rounding. Changes to the performance data may be reported as part of the company’s annual publications as new or updated data and/or emission methodologies become available. We are working to continuously improve our performance and methods to detect, measure, and address greenhouse gas emissions. ExxonMobil works with industry, including API and Ipieca, to improve emission factors and methodologies, including measurements and estimates.
- Based on Scope 1 and Scope 2 emissions from operated assets. Intensity is calculated as emissions per metric ton of throughput/production. ExxonMobil reported emissions, reductions, and avoidance performance data are based on a combination of measured and estimated emissions data using reasonable efforts and collection methods. Calculations are based on industry standards and best practices, including guidance from the American Petroleum Institute (API) and Ipieca. There is uncertainty associated with the emissions, reductions, and avoidance performance data due to variation in the processes and operations, the availability of sufficient data, quality of those data, and methodology used for measurement and estimation. Performance data may include rounding. Changes to the performance data may be reported as part of the Company’s annual publications as new or updated data and/or emission methodologies become available. We are working to continuously improve our performance and methods to detect, measure and address greenhouse gas emissions. ExxonMobil works with industry, including API and Ipieca, to improve emission factors and methodologies, including measurements and estimates.
- See our website at https://corporate.exxonmobil.com/news/news-releases for Jan.18, 2022, release of Scope 1 and Scope 2 net-zero ambition for operated assets by 2050.
- IEA (2025), World Energy Outlook 2025, IEA, Paris https://www.iea.org/reports/world-energy-outlook-2025, Licence: CC BY 4.0 (report); CC BY NC SA 4.0 (Annex A); IPCC: AR6 Scenarios Database hosted by International Institute for Applied Systems Analysis (IIASA) release 1.0 average. IPCC C3: "Likely Below 2°C" scenarios.
- Middle East and related disruptions to throughput may affect progress of our planned methane-intensity reductions in 2026; however, ExxonMobil’s 2030 methane-intensity reduction plan remains unchanged. Intensity is calculated as emissions per metric ton of throughput/production. ExxonMobil’s emission-reduction plans are based on Scope 1 and Scope 2 emissions from operated assets. ExxonMobil reported emissions, reductions, and avoidance performance data are based on a combination of measured and estimated emissions data using reasonable efforts and collection methods. Calculations are based on industry standards and best practices, including guidance from the American Petroleum Institute (API) and Ipieca. There is uncertainty associated with the emissions, reductions, and avoidance performance data due to variation in the processes and operations, the availability of sufficient data, quality of those data, and methodology used for measurement and estimation. Performance data may include rounding. Changes to the performance data may be reported as part of the Company’s annual publications as new or updated data and/or emission methodologies become available. We are working to detect, measure and address greenhouse gas emissions. ExxonMobil works with industry, including API and Ipieca, to improve emission factors and methodologies, including measurements and estimates.
- IPCC, 2023: Summary for Policymakers. In: Climate Change 2023: Synthesis Report. Contribution of Working Groups I, II and III to the Sixth Assessment Report of the Intergovernmental Panel on Climate Change [Core Writing Team, H. Lee and J. Romero (eds.)]. IPCC, Geneva, Switzerland, pp. 1-34, doi: 10.59327/IPCC/AR6-9789291691647.001; IEA (2025), World Energy Outlook 2025, IEA, Paris https://www.iea.org/reports/world-energy-outlook-2025, Licence: CC BY 4.0 (report); CC BY NC SA 4.0 (Annex A)
- References to routine flaring herein are consistent with the World Bank’s Zero Routine Flaring by 2030 Initiative/Global Flaring & Methane Reduction (GFMR) Partnership principle of routine flaring and excludes safety and non-routine flaring.
- This chart illustrates historical reductions and potential greenhouse gas abatement options for Scope 1 and 2 greenhouse gas emissions. The abatement options are not all-inclusive and are subject to change as a result of a number of factors, including abatement reduction magnitude, implementation timing, abatement cost, portfolio changes, policy developments, technology advancements, and as annual company plans are updated. Includes energy attribute certificates, such as renewable energy certificates (RECs) and guarantees of origin (GOOs). Historical reductions and potential abatement options have been normalized to exclude the impacts of divestments, acquisitions, and growth. Analysis as of March 2026.
- See our website at https://corporate.exxonmobil.com/news/news-releases for May 3, 2024, release announcing the completion of the Pioneer Natural Resources Company acquisition.
- Source: 2025 ExxonMobil Corporate Plan Update (Dec. 8, 2025)
- Based on ExxonMobil analysis for power plant use including EIA U.S. electricity net generation and resulting CO2 emissions: https://www.eia.gov/tools/faqs/faq.php?id=74&t=11. Reductions may vary based on regional differences and other variables.
- Emission metrics are based on assets operated by ExxonMobil, using the latest performance and plan data available as of March 13, 2026. Flaring intensity is calculated as m3 per metric ton of throughput or production. Methane intensity is calculated as metric tons CH4 per 100 metric tons of throughput or production. Calculations are based on industry standards and best practices, including guidance from the American Petroleum Institute (API) and Ipieca. There is uncertainty associated with the emissions, reductions, and avoidance performance data due to variation in the processes and operations, the availability of sufficient data, quality of those data, and methodology used for measurement and estimation. Performance data may include rounding. Changes to the performance data may be reported as part of the Company’s annual publications as new or updated data and/or emission methodologies become available. We are working to continuously improve our performance and methods to detect, measure and address greenhouse gas emissions. ExxonMobil works with industry, including API and Ipieca, to improve emission factors and methodologies, including measurements and estimates.
FORWARD-LOOKING STATEMENT WARNING
CAUTIONARY STATEMENT RELEVANT TO FORWARD LOOKING INFORMATION FOR THE PURPOSE OF THE “SAFE HARBOR” PROVISIONS OF THE PRIVATE SECURITIES LITIGATION REFORM ACT OF 1995 AND OTHER IMPORTANT LEGAL DISCLAIMERS
Images or statements of future ambitions, aims, aspirations, plans, goals, events, projects, projections, opportunities, expectations, performance, potential addressable markets or conditions in the publications, including plans to reduce, abate, avoid or enable avoidance of emissions or reduce emissions intensity, sensitivity analyses, estimates, the development of future technologies, business plans, and sustainability efforts are dependent on future market factors, such as customer demand, continued technological progress, stable policy support and timely rule-making or continuation of government incentives and funding, and represent forward-looking statements. Similarly, emission-reduction roadmaps to drive toward net zero and similar roadmaps for emerging technologies and markets, and water management roadmaps to reduce freshwater intake and/or manage disposal, are forward-looking statements. These statements are not guarantees of future corporate, market or industry performance or outcomes for ExxonMobil or society and are subject to numerous risks and uncertainties, many of which are beyond our control or are even unknown.
Actual future results, including the achievement of ambitions to reach Scope 1 and 2 net zero from operated assets by 2050, to reach Scope 1 and 2 net zero in integrated Upstream Permian Basin unconventional operated assets by 2035, to eliminate routine flaring in-line with World Bank Zero Routine Flaring, to reach near zero methane emissions from operated assets and other methane initiatives to meet ExxonMobil’s greenhouse gas emission reduction plans and goals, divestment and start-up plans, and associated project plans as well as technology advances, including in the timing and outcome of projects to capture, transport and store CO2, produce hydrogen and ammonia, produce lower-emission fuels, produce ProxximaTM systems, produce carbon materials, produce lithium, and use plastic waste as feedstock for advanced recycling; future debt levels and credit ratings; business and project plans, timing, costs, capacities and profitability; resource recoveries and production rates; planned Denbury and Pioneer integrated benefits; detection, measurement and quantification of emissions including obtaining or reporting of that data or updates to previous estimates and progress in sustainability focus areas could vary depending on a number of factors. These include, global or regional changes or imbalances in the supply and demand for oil, gas, petrochemicals, and feedstocks and other market factors; economic conditions and seasonal fluctuations that impact prices, differentials, and volume/mix for our products; new market products and services; future cash flows; our ability to execute operational objectives on a timely and successful basis; the ability to realize efficiencies within and across our business lines; developments or changes in local, national, or international treaties, laws, regulations, taxes, trade sanctions, trade tariffs, or policies affecting our business, such as government policies supporting lower-carbon and new market investment opportunities, or policies limiting the attractiveness of investments such the punitive European taxes on the oil and gas sector and unequal support for different technological methods of emissions reduction or evolving, ambiguous, and unharmonized voluntary and mandatory standards and extraterritorial laws and regulations imposed by various jurisdictions related to sustainability and greenhouse gas reporting and evolving measurement standards for these topics; timely granting of governmental permits, licenses, and certifications; uncertain impacts of deregulation on the legal and regulatory environment; trade patterns and the development and enforcement of local, national and regional mandates; unforeseen technical or operational difficulties; the outcome of research efforts and future technology developments, including the ability to scale projects and technologies such as electrification of operations, advanced recycling, carbon capture and storage, hydrogen and ammonia production, ProxximaTM systems, carbon materials or direct lithium extraction on a commercially competitive basis; the development and competitiveness of alternative energy and emission reduction technologies; unforeseen technical or operating difficulties, including the need for unplanned maintenance; availability of feedstocks for lower-emission fuels, hydrogen, or advanced recycling; changes in the relative energy mix across activities and geographies; the actions of co-venturers or competitors; changes in regional and global economic growth rates and consumer preferences including willingness and ability to pay for reduced emissions products; actions taken by governments and consumers resulting from a pandemic; changes in population growth, economic development or migration patterns; timely completion of construction projects; war, civil unrest, attacks against the Company or industry, and other political or security disturbances, including disruption of land or sea transportation routes; decoupling of economies, realignment of global trade and supply chain networks, and disruptions in military alliances; and other factors discussed here and in Item 1A. Risk Factors of our Annual Report on Form 10-K and under the heading “Factors affecting future results” available under the “Earnings” tab through the “Investors” page of our website at www.exxonmobil.com. The Advancing Climate Solutions Report includes 2025 greenhouse gas emissions performance data as of March 13, 2026, and Scope 3 Category 11 estimates for full year 2025 as of March 13, 2026. The greenhouse gas intensity and greenhouse gas emission estimates include Scope 2 market-based emissions. The Sustainability Report, the Advancing Climate Solutions Report, and combined Executive Summary were issued on May 5, 2026. The content and data referenced in these publications focus primarily on our operations from Jan. 1, 2025 – Dec. 31, 2025, unless otherwise indicated. Tables on our “Metrics and data” page were updated to reflect full year 2025 data. Information regarding some known events or activities in 2026 and historical initiatives from prior years are also included. No party should place undue reliance on these forward-looking statements, which speak only as of the dates of these publications. All forward-looking statements are based on management’s knowledge and reasonable expectations at the time of publication. ExxonMobil assumes no duty to update these statements or materials as of any future date, and neither future distribution of this material nor the continued availability of this material in archive form on our website should be deemed to constitute an update or re-affirmation of these figures or statements as of any future date. Any future update will be provided only through a public disclosure indicating that fact.
See “ABOUT THE ADVANCING CLIMATE SOLUTIONS AND SUSTAINABILITY REPORTS” at the end of this document for additional information on these reports and the use of non-GAAP and other financial measures.
ABOUT THE ADVANCING CLIMATE SOLUTIONS AND SUSTAINABILITY REPORTS
The Advancing Climate Solutions Report contains terms used by the third-party disclosure frameworks. In doing so, ExxonMobil is not obligating itself to use any terms in the way defined or interpreted by any third-party, nor is it obligating itself to comply with any specific recommendation of such parties or to provide any specific disclosure. For example, with respect to the term “material,” individual companies are best suited to determine what information is material, under the long-standing U.S. Supreme Court definition, and whether to include this information in U.S. Securities and Exchange Act filings. The Sustainability Report and Advancing Climate Solutions Report are each a voluntary disclosure and are not designed to fulfill any U.S., foreign, or third-party required reporting framework.
Forward-looking and other statements regarding environmental and other sustainability efforts and aspirations are not intended to communicate any material investment information under the laws of the United States or elsewhere or represent that these are required disclosures in any other context or jurisdiction. These publications are not intended to imply that ExxonMobil has access to any significant non-public insights on future events that the reader could not independently research. In addition, historical, current, and forward-looking environmental, climate-related, and other sustainability-related statements may be based on standards for measuring progress that are still developing, internal controls and processes that continue to evolve, and assumptions that are subject to change in the future, including future laws and rulemaking. Forward-looking and other statements regarding environmental and other sustainability efforts and aspirations are for informational purposes only and are not intended as an advertisement for ExxonMobil’s equity, debt, businesses, products, or services and the reader is specifically notified that any investor-requested disclosure or future required disclosure is not and should not be construed as an inducement for the reader to purchase any product, services, or security. The statements and analysis in these publications represent a good faith effort by the Company to address these investor requests despite significant unknown variables and at times inconsistent market data, government policy signals, and calculation methodologies and reporting standards.
Actions needed to advance ExxonMobil’s 2030 greenhouse gas emission-reductions plans are incorporated into its medium-term business plans, which are updated annually. The reference case for planning beyond 2030 is based on the Company’s Global Outlook research and publication. The Global Outlook is reflective of the existing global policy environment and an assumption of increasing policy stringency and technology improvement to 2050. However, the Global Outlook does not attempt to project the degree of required future policy and technology advancement and deployment for the world, or ExxonMobil, to meet net zero by 2050. As future policies and technology advancements emerge, they will be incorporated into the GIobal Outlook, and the Company’s business plans will be updated as appropriate. References to projects or opportunities may not reflect investment decisions made by the corporation or its affiliates. Individual projects or opportunities may advance based on a number of factors, including availability of stable and supportive policy, permitting, technological advancement for cost-effective abatement, insights from the company planning process, and alignment with our partners and other stakeholders. Capital investment guidance in lower-emission and other new investments is based on our corporate plan; however, actual investment levels will be subject to the availability and attractiveness of investment opportunities, market conditions, stable public policy support, other factors, and focused on returns.
Energy demand modeling is forward-looking by nature aims to replicate integrated dynamics of the global energy system but necessarily involves simplifications to simulate its complexity. The reference to any modeled scenario or any pathway for an energy transition or expansion, including any potential net-zero scenario, does not imply ExxonMobil views any particular scenario as likely to occur. In addition, energy demand scenarios require assumptions on a variety of parameters. As such, the outcome of any given scenario using an energy demand model comes with a high degree of uncertainty. Third-party scenarios discussed in these reports reflect the modeling assumptions and outputs of their respective authors, not ExxonMobil, and their use or inclusion herein is not an endorsement by ExxonMobil of their underlying assumptions, likelihood, or probability. Investment decisions are made on the basis of ExxonMobil’s separate planning process but may be secondarily tested for robustness or resiliency against different assumptions, including against various scenarios. These reports contain information from third parties. ExxonMobil makes no representation or warranty as to the third-party information. Where necessary, ExxonMobil received permission to cite third-party sources, but the information and data remain under the control and direction of the third parties. ExxonMobil has also provided links in this report to third-party websites for ease of reference. ExxonMobil’s use of the third-party content is not an endorsement or adoption of such information.
ExxonMobil reported emissions, including reductions and avoidance performance data, are based on a combination of measured and estimated data. We assess our performance to support continuous improvement throughout the organization using our Environmental Performance Indicator (EPI) manual. The reporting guidelines and indicators in the Ipieca, the American Petroleum Institute (API), the International Association of Oil and Gas Producers Sustainability Reporting Guidance for the Oil and Gas Industry (5th edition, 2025) and key chapters of the GHG Protocol inform the EPI and the selection of the data reported. Emissions reported are estimates only, and performance data depends on variations in processes and operations, the availability of sufficient data, the quality of those data and methodology used for measurement and estimation. Emissions data is subject to change as methods, data quality, and technology improvements occur, and changes to performance data may be updated. Emissions, reductions, abatements and enabled avoidance estimates for non-ExxonMobil operated facilities are included in the equity data and similarly may be updated as changes in the performance data are reported. ExxonMobil’s plans to reduce emissions are good-faith efforts based on current relevant data and methodology, which could be changed or refined. ExxonMobil works to continuously improve its approach to estimate, detect, measure, and address emissions. ExxonMobil actively engages with industry, including API and Ipieca, to improve emission factors and methodologies, including measurements and estimates.
Any reference to ExxonMobil’s support of, work with, or collaboration with a third-party organization within these publications do not constitute or imply an endorsement by ExxonMobil of any or all of the positions or activities of such organization. ExxonMobil participates, along with other companies, institutes, universities and other organizations, in various initiatives, campaigns, projects, groups, trade organizations, and other collaborations among industry and through organizations like the United Nations that express various ambitions, aspirations and goals related to climate change, emissions, sustainability, and an energy transition or expansion. ExxonMobil’s participation or membership in such collaborations is not a promise or guarantee that ExxonMobil’s individual ambitions, future performance or policies will align with the collective ambitions of the organizations or the individual ambitions of other participants, all of which are subject to a variety of uncertainties and other factors, many of which may be beyond ExxonMobil’s control, including government regulation, availability and cost-effectiveness of technologies, and market forces, geopolitical, realignment, conflicts and other risks and uncertainties. Such third parties’ statements of collaborative or individual ambitions and goals frequently diverge from ExxonMobil’s own ambitions, plans, goals, commitments and investments. ExxonMobil will continue to make independent decisions regarding the operation of its business, including its climate-related and sustainability-related ambitions, plans, goals, commitments, and investments. ExxonMobil’s future ambitions, plans, goals commitments, and investments reflect ExxonMobil’s current plans, and ExxonMobil may unilaterally change them for various reasons, including adoption of new reporting standards or practices, market conditions; changes in its portfolio; and financial, operational, regulatory, reputational, legal and other factors.
References to “resources,” “resource base,” and similar terms refer to the total remaining estimated quantities of oil and natural gas that are expected to be ultimately recoverable. The resource base includes quantities of oil and natural gas classified as proved reserves, as well as quantities that are not yet classified as proved reserves, but that are expected to be ultimately recoverable. The term “resource base” is not intended to correspond to SEC definitions such as “probable” or “possible” reserves. For additional information, see the “Frequently Used Terms” on the Investors page of the Company’s website at www.exxonmobil.com under the header “Modeling Toolkit.” References to “oil” and “gas” include crude, natural gas liquids, bitumen, synthetic oil, and natural gas. The term “project” as used in these publications can refer to a variety of different activities and does not necessarily have the same meaning as in any government payment transparency reports.
Exxon Mobil Corporation has numerous affiliates, many with names that include ExxonMobil, Exxon, Mobil, Esso, and XTO. For convenience and simplicity, those terms and terms such as “Corporation,” “company,” “our,” “we,” and “its” are sometimes used as abbreviated references to one or more specific affiliates or affiliate groups. Abbreviated references describing global or regional operational organizations, and global or regional business lines are also sometimes used for convenience and simplicity. Nothing contained herein is intended to override the corporate separateness of affiliated companies. Exxon Mobil Corporation’s goals do not guarantee any action or future performance by its affiliates or Exxon Mobil Corporation’s responsibility for those affiliates’ actions and future performance, each affiliate of which manages its own affairs. For convenience and simplicity, words like venture, joint venture, partnership, co-venturer and partner are used to indicate business relationships involving common activities and interests, and those words may not indicate precise legal relationships. These publications cover Exxon Mobil Corporation’s owned and operated businesses and do not address the performance or operations of our suppliers, contractors or partners unless otherwise noted. In the case of certain joint ventures for which ExxonMobil is the operator, we often exercise influence but not control. Thus, the governance, processes, management and strategy of these joint ventures may differ from those in these reports. ExxonMobil completed the acquisitions of Denbury Inc. and Pioneer Natural Resources Company in 2023 and 2024, respectively. These reports and the data therein do not speak of these companies’ pre-acquisition governance, risk management, strategy approaches, or emissions or sustainability performance unless specifically referenced.
These reports or any material therein are not to be used or reproduced without the permission of Exxon Mobil Corporation. All rights reserved
SUPPLEMENTAL INFORMATION FOR NON-GAAP AND OTHER MEASURES
The Positioned for Growth in a Lower-Emission Future section of the Advancing Climate Solutions Report mentions our assessment of the strength our business and investment portfolio against a range of future outcomes, including third-party scenarios. The Company believes this can be helpful in assessing the resiliency of the business to generate cash from different potential future markets. The performance data presented in the Advancing Climate Solutions Report and Sustainability Report, including on emissions, is not financial data and is not GAAP data.